Important note about SSL VPN compatibility for 20.0 MR1 with EoL SFOS versions and UTM9 OS. Learn more in the release notes.

Parents
  • It seems to be using a lot less RAM. Been running 3.5 hours and averaging 67% RAM usage. Usage goes up over time, so it may settle in at a higher average, but v18.5 was using about 75% on average and v19 GA was using about 80% on average, for me.

    Had a crash of v19 GA this afternoon where the blue (storage) light blinks like crazy and I slowly lose capabilities until the AP goes orange, etc and have to reboot. (This has happened maybe once a month for me, maybe once every two months.) Hopefully fixed in v19 MR1.

  • Just checked my machine. Before upgrading memory was stable around 70%, since the upgrade it climbed to now being 78%

    I'll keep monitoring this.

     
    SFVH (SFOS 20.0.0 GA-Build222) - Last (re)boot on November 6th  2023
    Asus H410i-plus - Pentium 6605 Gold - 250GB M.2 PCIe NVMe SSD - 8GB - 3 ports
    [If any of my posts are helpful to you please use the 'Verify Answer' link]
  • Mine is now sitting at 79%, On last experience I would have expected a larger drop after a couple of days.

    Ian

    XG115W - v20.0.2 MR-2 - Home

    XG on VM 8 - v21 GA

    If a post solves your question please use the 'Verify Answer' button.

  • There does appear to be a memory leak with this build or something going on. I started around 45% memory usage after upgrading. Now I’m sitting at 90% memory usage after four days of uptime. I’m usually around 50-60% with the previous build.

    ---

    Sophos XG guides for home users: https://shred086.wordpress.com/

  • Could you please send us a Screenshot of the webadmin and the memory consumption? 

    Also check via atop on the CLI, which process is consuming so much memory. 

    __________________________________________________________________________________________________________________

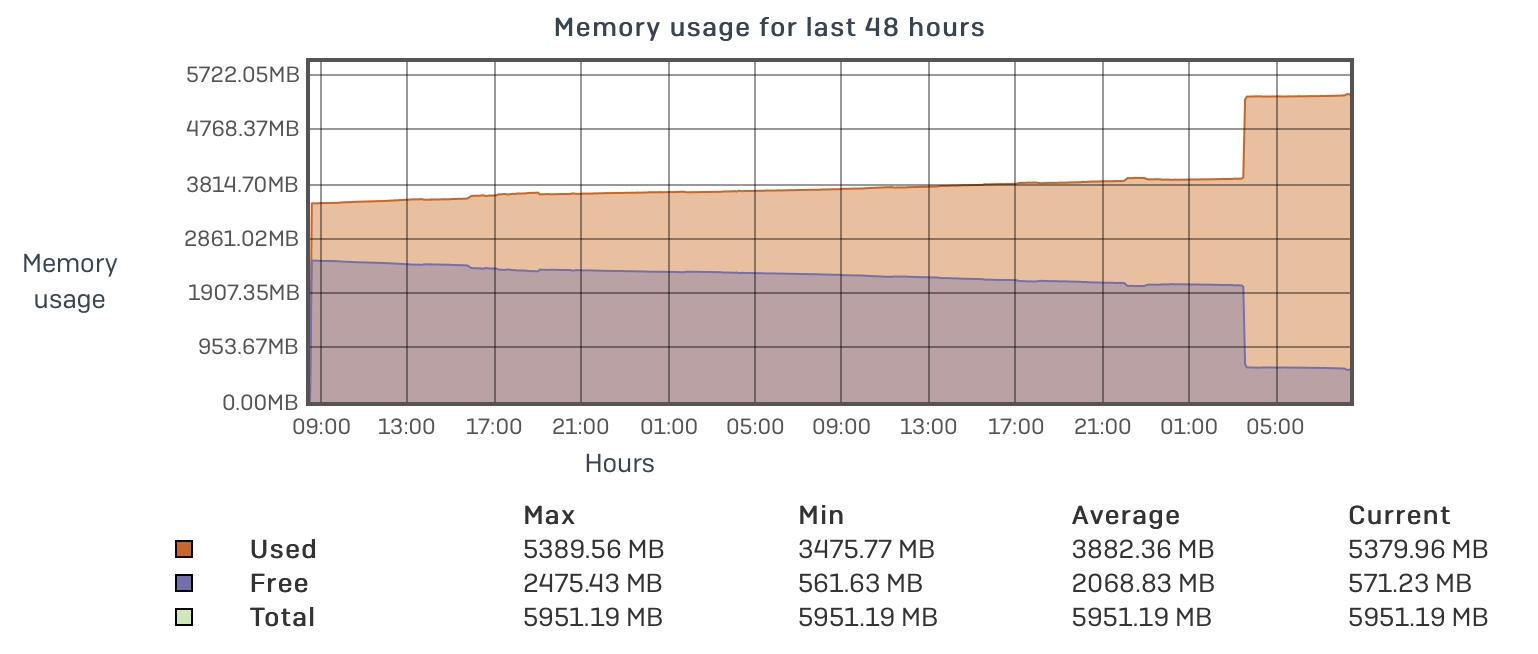
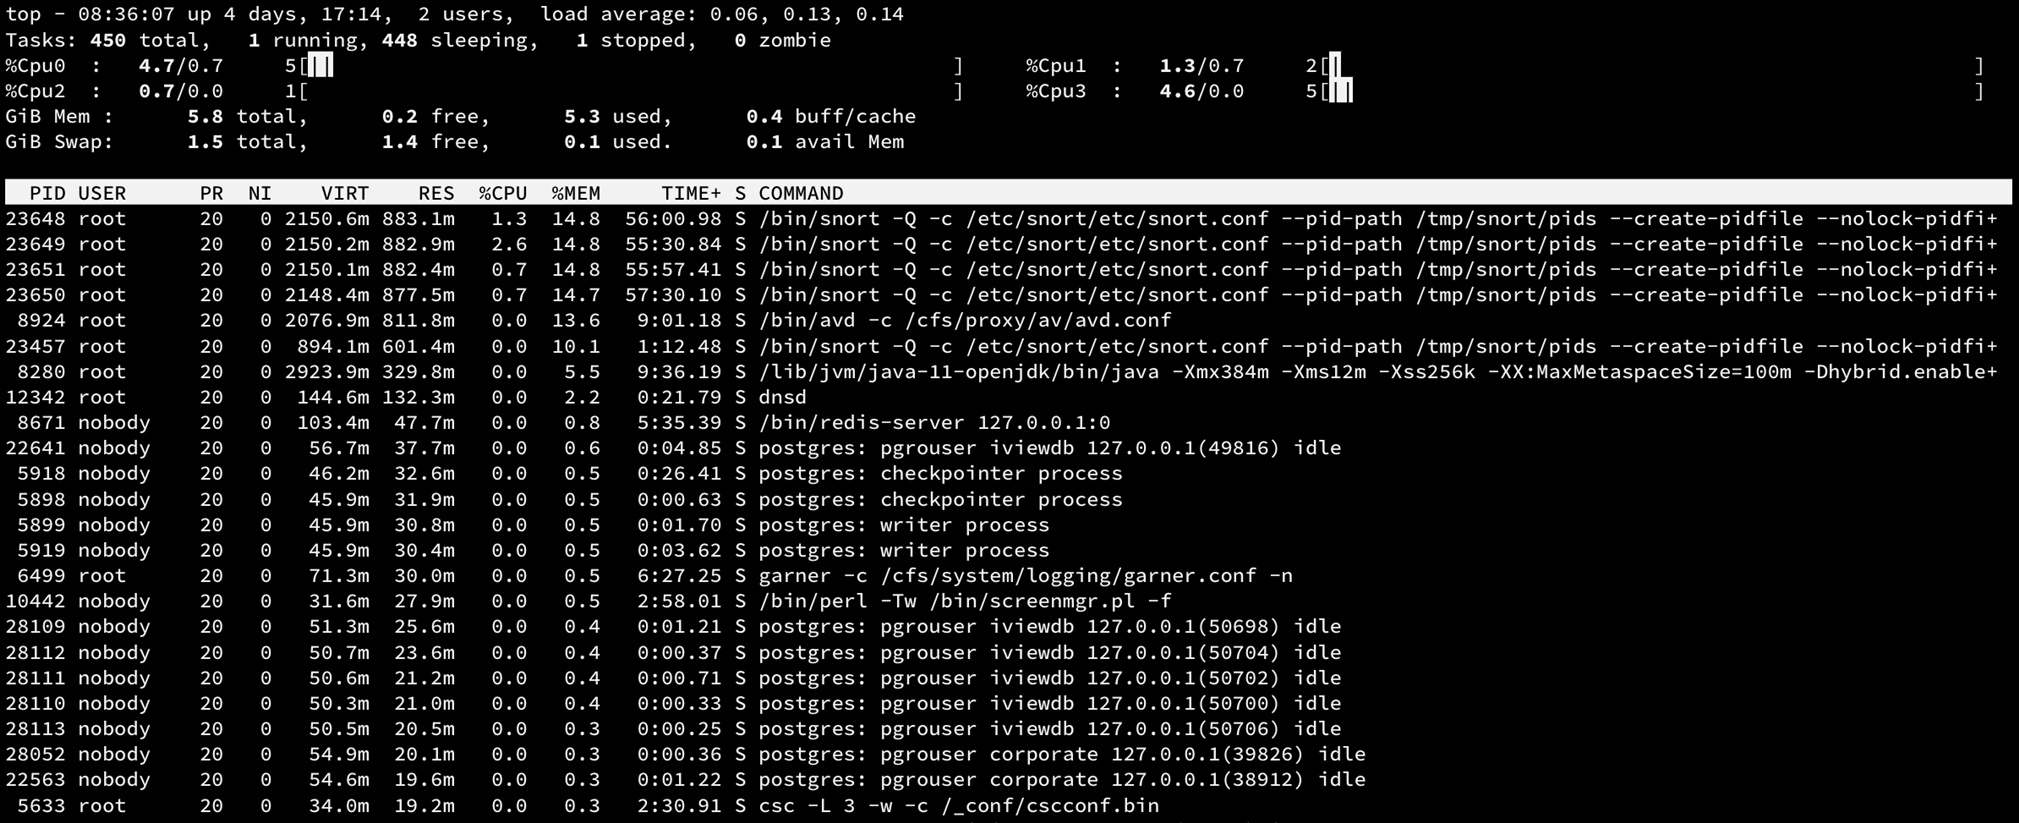
  • It looks like there was a sudden jump in memory usage. top is showing snort processes consuming the most currently.

    ---

    Sophos XG guides for home users: https://shred086.wordpress.com/

  • Does any of those time values match with the sudden increase of the RAM? 

    You see the run time and the increase seems to be some hours ago. Which process matches? 

    __________________________________________________________________________________________________________________

  • Looking at the memory usage graph, it appears the increase in memory was at 3:34 AM local time. It was around 9:00 AM local time when I looked at top, so about 5 hours and 30 minutes from the increase in memory usage. It looks like it was an increase of 1,437 MB and I none of the times in top seem to correspond to an increase around that time (just looking at what appears to be the uptime for each process in top). 

    I’ll keep letting it run for now to see what happens but I’ll reboot at some point if nothing changes and try to get some before and after screenshots.

    ---

    Sophos XG guides for home users: https://shred086.wordpress.com/

  • Hello shred,

    I have exactly the same experience on my virtual app. For a long time, the RAM memory is at about 50%, but now it is at 89%. But according to the RAM load graph, the spike didn't come until midday today. Probably a bad snort engine update?

    Regards

    alda

  • Ah that’s a good point on updates. Looking at mine, it looks like my IPS signatures haven’t been updated since 28 Jul but my AV and ATP was updated at 03:29:01, Aug 01 2022 which corresponds closely to the big jump in memory usage.

    ---

    Sophos XG guides for home users: https://shred086.wordpress.com/

Reply Children