After update to version 9.719 IPS not working properly anymore. Every 10 minutes snort not running - restarted messages.
This thread was automatically locked due to age.
Hey SZSZ ,
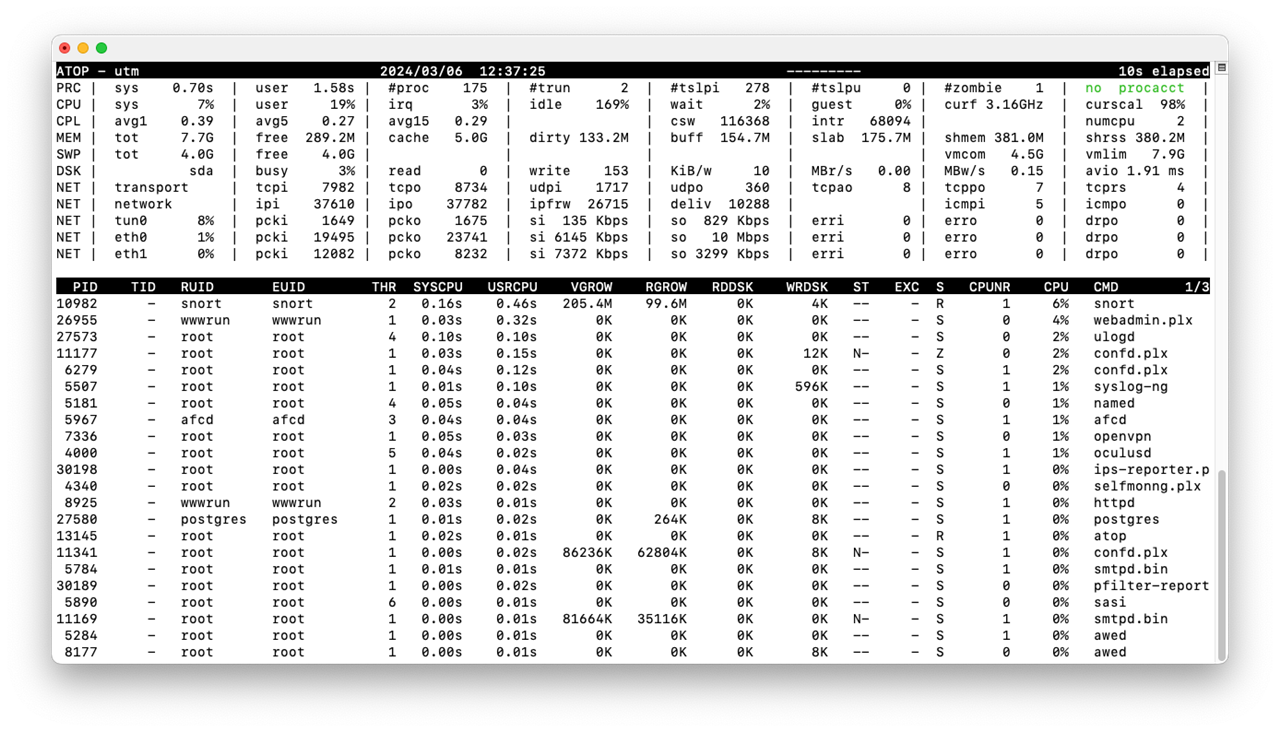
Thank you for reaching out to the community, during that can you check with atop if other services are too getting impacted ?
REF - A guide to recording UTM process usage using atop.
Thanks & Regards,
_______________________________________________________________
Vivek Jagad | Team Lead, Technical Support, Global Customer Experience
Log a Support Case | Sophos Service Guide
Best Practices – Support Case | Security Advisories
Compare Sophos next-gen Firewall | Fortune Favors the prepared
Sophos Community | Product Documentation | Sophos Techvids | SMS
If a post solves your question please use the 'Verify Answer' button.

After 30 mins have you seen any spike any of the services including snort ?
Thanks & Regards,
_______________________________________________________________
Vivek Jagad | Team Lead, Technical Support, Global Customer Experience
Log a Support Case | Sophos Service Guide
Best Practices – Support Case | Security Advisories
Compare Sophos next-gen Firewall | Fortune Favors the prepared
Sophos Community | Product Documentation | Sophos Techvids | SMS
If a post solves your question please use the 'Verify Answer' button.
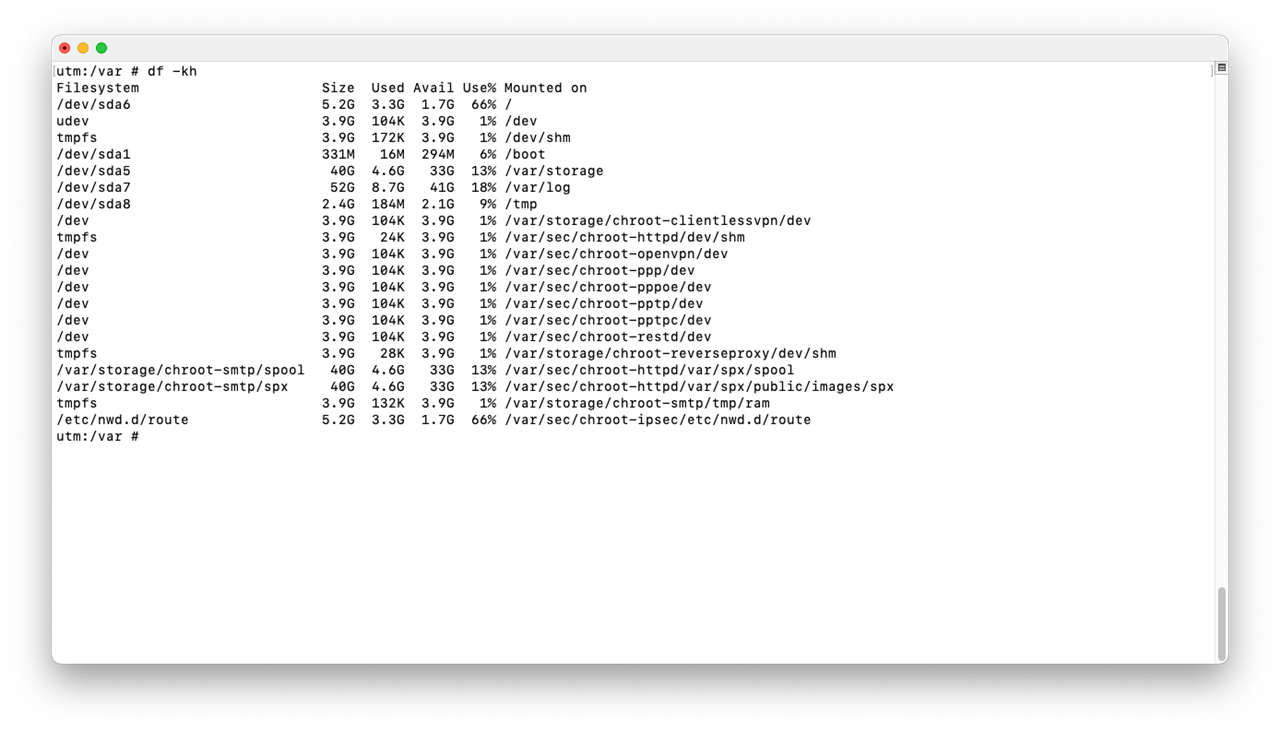
Okay, and what about the disk utilization can you share cd /var > df -kh output...
Thanks & Regards,
_______________________________________________________________
Vivek Jagad | Team Lead, Technical Support, Global Customer Experience
Log a Support Case | Sophos Service Guide
Best Practices – Support Case | Security Advisories
Compare Sophos next-gen Firewall | Fortune Favors the prepared
Sophos Community | Product Documentation | Sophos Techvids | SMS
If a post solves your question please use the 'Verify Answer' button.
can are you seeing any suspicious logs under the /var/log/ips.log ? during the time there is a spike or stopped working observed...
Thanks & Regards,
_______________________________________________________________
Vivek Jagad | Team Lead, Technical Support, Global Customer Experience
Log a Support Case | Sophos Service Guide
Best Practices – Support Case | Security Advisories
Compare Sophos next-gen Firewall | Fortune Favors the prepared
Sophos Community | Product Documentation | Sophos Techvids | SMS
If a post solves your question please use the 'Verify Answer' button.

Here is an excerpt from today 12:37. That's when it started.
2024:03:06-11:51:24 utm snort[16131]: Decoding Raw IP4
2024:03:06-11:54:02 utm snort[16131]: S5: Session exceeded configured max bytes to queue 1048576 using 1049118 bytes (client queue). X.X.X.3 61457 --> X.X.X.53 445 (0) : LWstate 0x48 LWFlags 0x2107
2024:03:06-12:14:35 utm snort[16131]: S5: Session exceeded configured max bytes to queue 1048576 using 1048582 bytes (client queue). X.X.X.71 55893 --> X.X.X.210 445 (0) : LWstate 0x48 LWFlags 0x402107
2024:03:06-12:16:31 utm snort[16131]: S5: Session exceeded configured max bytes to queue 1048576 using 1055146 bytes (client queue). X.X.X.223 59675 --> X.X.X.53 445 (0) : LWstate 0x48 LWFlags 0x402107
2024:03:06-12:19:02 utm snort[16131]: S5: Session exceeded configured max bytes to queue 1048576 using 1051064 bytes (client queue). X.X.X.145 54560 --> X.X.X.205 80 (0) : LWstate 0x9 LWFlags 0x406007
2024:03:06-12:26:23 utm snort[16131]: S5: Session exceeded configured max bytes to queue 1048576 using 1049796 bytes (client queue). X.X.X.120 51767 --> X.X.X.11 80 (0) : LWstate 0x9 LWFlags 0x406007
2024:03:06-12:33:42 utm snort[16131]: S5: Session exceeded configured max bytes to queue 1048576 using 1056700 bytes (client queue). X.X.X.120 52045 --> X.X.X.11 80 (0) : LWstate 0x9 LWFlags 0x406007
2024:03:06-12:33:45 utm snort[16131]: S5: Session exceeded configured max bytes to queue 1048576 using 1053423 bytes (client queue). X.X.X.71 54072 --> X.X.X.11 80 (0) : LWstate 0x48 LWFlags 0x406107
2024:03:06-12:37:13 utm snort[10982]: Enabling inline operation
2024:03:06-12:37:13 utm snort[10982]: Running in IDS mode
2024:03:06-12:37:13 utm snort[10982]:
2024:03:06-12:37:13 utm snort[10982]:         --== Initializing Snort ==--
2024:03:06-12:37:13 utm snort[10982]: Initializing Output Plugins!
2024:03:06-12:37:13 utm snort[10982]: Initializing Preprocessors!
2024:03:06-12:37:13 utm snort[10982]: Initializing Plug-ins!
2024:03:06-12:37:13 utm snort[10982]: Parsing Rules file "/etc/snort/snort.conf"
2024:03:06-12:37:16 utm snort[10982]: PortVar 'HTTP_PORTS' defined :
Hey SZSZ , you can follow the following KBA - IPS configuration to prevent high CPU usage.
Thanks & Regards,
_______________________________________________________________
Vivek Jagad | Team Lead, Technical Support, Global Customer Experience
Log a Support Case | Sophos Service Guide
Best Practices – Support Case | Security Advisories
Compare Sophos next-gen Firewall | Fortune Favors the prepared
Sophos Community | Product Documentation | Sophos Techvids | SMS
If a post solves your question please use the 'Verify Answer' button.
Have we tried a normal reboot or postgres check ?
Thanks & Regards,
_______________________________________________________________
Vivek Jagad | Team Lead, Technical Support, Global Customer Experience
Log a Support Case | Sophos Service Guide
Best Practices – Support Case | Security Advisories
Compare Sophos next-gen Firewall | Fortune Favors the prepared
Sophos Community | Product Documentation | Sophos Techvids | SMS
If a post solves your question please use the 'Verify Answer' button.
just check the status: ps aux | grep postgres
Thanks & Regards,
_______________________________________________________________
Vivek Jagad | Team Lead, Technical Support, Global Customer Experience
Log a Support Case | Sophos Service Guide
Best Practices – Support Case | Security Advisories
Compare Sophos next-gen Firewall | Fortune Favors the prepared
Sophos Community | Product Documentation | Sophos Techvids | SMS
If a post solves your question please use the 'Verify Answer' button.
utm:/root # ps aux | grep postgres
postgres  2437  0.0  0.1 1112976 11588 ?       Ss   00:05   0:00 postgres: reporting reporting [local] idle
postgres  4117  0.0  0.5 1109492 47092 ?       S    Mar05   0:02 /usr/pgsql92/bin/postgres -D /var/storage/pgsql92/data
postgres  4119  0.0  2.2 1110132 186208 ?      Ss   Mar05   0:08 postgres: checkpointer process
postgres  4120  0.0  0.0 1110008 7488 ?        Ss   Mar05   0:00 postgres: writer process
postgres  4121  0.0  0.2 1110008 17244 ?       Ss   Mar05   0:11 postgres: wal writer process
postgres  4122  0.0  0.0 1110756 2188 ?        Ss   Mar05   0:01 postgres: autovacuum launcher process
postgres  4123  0.0  0.0  10292   760 ?        Ss   Mar05   0:00 postgres: archiver process   last was 00000001000002A900000006
postgres  4124  0.0  0.0  10564  1076 ?        Ss   Mar05   0:08 postgres: stats collector process
postgres  5315  0.0  0.0 1112736 6336 ?        Ss   Mar05   0:01 postgres: hotspot hotspot 127.0.0.1(58637) idle
postgres  5800  0.0  0.0 1112512 5696 ?        Ss   Mar05   0:00 postgres: smtp smtp 127.0.0.1(58657) idle
postgres  5844  0.0  0.4 1112836 33872 ?       Ss   Mar05   0:03 postgres: smtp smtp 127.0.0.1(58659) idle
postgres  7339  0.0  0.0 1112596 5760 ?        Ss   15:15   0:00 postgres: smtp smtp 127.0.0.1(35231) idle
postgres  7341  0.0  0.0 1112620 5624 ?        Ss   15:15   0:00 postgres: smtp smtp 127.0.0.1(35233) idle
root      8578  0.0  0.0   5944   756 pts/0    S+   15:16   0:00 grep postgres
postgres 18363  0.0  0.2 1113964 20856 ?       Ss   08:16   0:01 postgres: smtp smtp 127.0.0.1(48661) idle
postgres 24931  0.0  0.0 1112616 5656 ?        Ss   07:14   0:00 postgres: hotspot hotspot 127.0.0.1(46867) idle
postgres 27580  0.1  1.6 1113164 134872 ?      Ss   Mar05   1:52 postgres: reporting reporting [local] idle
postgres 30213  0.0  0.0 1112508 4284 ?        Ss   00:00   0:00 postgres: smtp smtp [local] idle
postgres 30216  0.0  0.0 1112508 4284 ?        Ss   00:00   0:00 postgres: smtp smtp [local] idle
postgres 30217  0.0  0.0 1112784 5904 ?        Ss   00:00   0:00 postgres: reporting reporting [local] idle
postgres 30218  0.0  0.0 1112508 3708 ?        Ss   00:00   0:00 postgres: reporting reporting [local] idle
postgres 30271  0.0  0.0 1112628 4908 ?        Ss   00:00   0:00 postgres: hotspot hotspot [local] idle
postgres 30332  0.0  0.0 1112628 4912 ?        Ss   00:00   0:00 postgres: hotspot hotspot [local] idle
postgres 31235  0.0  0.0 1112520 4108 ?        Ss   00:00   0:00 postgres: sandbox sandbox [local] idle
postgres 31237  0.0  0.0 1112572 4992 ?        Ss   00:00   0:00 postgres: sandbox sandbox [local] idle
Looks perfectly normal...
Thanks & Regards,
_______________________________________________________________
Vivek Jagad | Team Lead, Technical Support, Global Customer Experience
Log a Support Case | Sophos Service Guide
Best Practices – Support Case | Security Advisories
Compare Sophos next-gen Firewall | Fortune Favors the prepared
Sophos Community | Product Documentation | Sophos Techvids | SMS
If a post solves your question please use the 'Verify Answer' button.