Hi All,
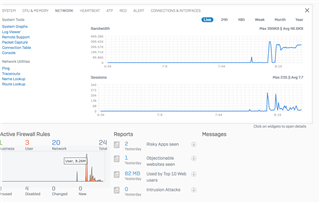
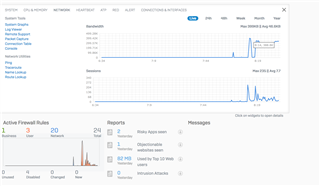
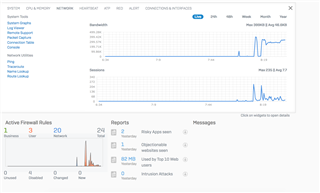
After years of XG usage, I still cannot understand in the CC which graph is the correct one. I only have one user role and look at the graphs that CC reports:
Looking at the command line output:
system diagnostics utilities bandwidth-monitor
it reports like "bandwidth graph". I have a 100Mb at home and I never reach more than 8 Mb behind XG. Yes I know about IPS, Web Proxy and Anti-malware scanning but graphs are not reporting correct information at all. This is the feeling I have.
What about other guys on Community?
Regards
This thread was automatically locked due to age.


