Customers might be unable to connect with us via the Sophos Malaysia Support Hotline number. Our teams are actively working on a fix. In the interim, we request customers to use the backup hotline number - +65 3157 5922 (Singapore) or raise a support request at https://support.sophos.com/.

Help us enhance your Sophos Community experience. Share your thoughts in our Sophos Community survey.

This discussion has been locked.
You can no longer post new replies to this discussion. If you have a question you can start a new discussion

Database Rebuild

Hi Team,

My ASG 525 HA - 8.309 is taking too much time (unable to query the objects some time) to query the object - show where this object is in use and last change [IN network definition].

I have 1273 network definition hosts.

I'm thinking rebuild the database , is it gonna help me ??

/etc/init.d/postgresql rebuild  => what would be the effect of this command ??

will its gonna effect my web security logs ??

Or anything else is the fix of this issue

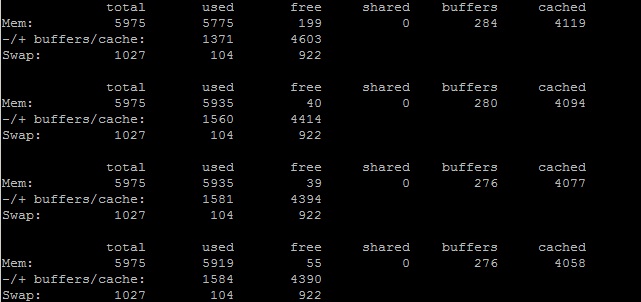
I have attached the snap of CPU & MEMORY UTILIZATION which is normal.

and also I'm continuously getting below mentioned logs in confd.log
var/HuirlwoAlxXZGpLqGpZh/downloads/singlelogfile/confd.log


2013:04:22-00:25:09 FW_INTRA_HO-2 confd[7872]: W main::cleanup_sessions:984() => id="3100" severity="warn" sys="System" sub="confd" name="timeout: removing session" sid="xLeXcQwSysmPCWFdBDQg"
2013:04:22-00:25:09 FW_INTRA_HO-2 confd[7872]: W main::cleanup_sessions:966() => id="3100" severity="warn" sys="System" sub="confd" name="removing corrupted session" sid="xLeXcQwSysmPCWFdBDQg.lock"

I have attached the snap of the query objects , which show that the process was  stopped.


This thread was automatically locked due to age.
  • I believe this is related to a bug.  Please have your reseller submit a support request to Sophos.

    The PostgreSQL rebuild doesn't touch your logs, only the databases used in reporting.  It's not clear to me when it erases the content of one of those by reinitializing it and when it doesn't.  If a rebuild helps you, please report it here.

    Cheers - Bob
     
    Sophos UTM Community Moderator
    Sophos Certified Architect - UTM
    Sophos Certified Engineer - XG
    Gold Solution Partner since 2005
    MediaSoft, Inc. USA
  • Hi once again bobsir,

    I have already logged the ticket & the support told me that the number of objects are too much for the astaro & they cant do any thing about that .

    And suggested to upgrade to UTM9 but i dont want to go for it.

    Can you guide me that it requires downtime??
    Or the astaro will work while the data base is rebuilding ??

    what would be the worst scenario by this activity..
    As it's HO & the critical site for me.

    Any idea about logs..
  • Hi, as Bob said, a DB rebuild probably won't help this issue, nor would it affect the logs.

    Can you consolidate some of your definitions into larger network defs?
    e.g. 2 adjacent /24's may become a /23 'supernet'.
    etc.

    Barry
  • There shouldn't be any noticible interruption when rebuilding the databases, but I agree with Barry that it's not likely to help.

    I'm not sure I buy the response from support unless you have a very, very old 525 - even then, I'm suspicious.  I have a client with a new UTM 120 - they have 883 total definitions and I don't have any problem with the info button.

    I suspect that you should insist on escalation of your problem.  Please give us the counts of DNS Hosts & Groups, Services definitions,  Firewall rules, NAT rules, users, daily volumes of maxes and mins for traffic, number of emails scanned, number of Web Filtering Profiles, etc.

    Cheers - Bob
     
    Sophos UTM Community Moderator
    Sophos Certified Architect - UTM
    Sophos Certified Engineer - XG
    Gold Solution Partner since 2005
    MediaSoft, Inc. USA
  • Hi Team,

    I have 1 ASG - 1.5 year old & 2 ASG - 0.5 year old with below configuration.

    Node 1 => 4Core Intel(R) Xeon(R) CPU E5220  @ 2.33GHz, RAM - 6GB , SWAP - 1GB , Log Disk - 150GB , Data Disk - 120 GB
    Node 2 => 4Core Intel(R) Xeon(R) CPU E5220  @ 2.33GHz, RAM - 6GB , SWAP - 1GB , Log Disk - 235GB , Data Disk - 180 GB

    And below are the number of definitions.

    Users/Groups - 676
    Networks - 128
    Hosts - 410
    Gruops - 40
    DNS Group - 3
    DNS Hosts - 1
    Web filtering Profile - 51
    NAT Rule - 0 (Done on my gateway - Checkpoint cluster)
    Email Scanning - off
    Application Control - off
    IPS Scannning  - off
    Wireless & RED  - No
    VPN - No
    FTP Proxy - No


    Max & Min traffic on LAN
    Maximum          Minimum          Average
    265.54 Mbps 158.82 kbps 14.17 Mbps

    Concurrent Connections
    Maximum Minimum Average
    25970 2107         7322


    Log Reporting Setting Time =>

    Accounting - 1 month
    Authentication - 1 month
    Firewall - 1 month
    Remote Access - 3 months
    Web Application Firewall - 3 months
    Web Security - 6 months (Big as per the support team - told me to make it 3 months)

    If any thing else , let me know
  • Hi 

    another thing is below output , is cache is taking too much memory thats why i'm facing the issue??

     FW_INTRA_HO:/home/login # free -m
                     total       used       free     shared    buffers     cached
    Mem:          5975       5701        273          0        275       4224
    -/+ buffers/cache:       1202       4773
    Swap:         1027        104        922
  • Hi Team,

    Another thing is this attached snap , seem the caching is taking the too much memory.

    Is this the reason i'm facing the issue ??
  • Hi Yagnesh,

    I wouldn't worry about the cached value. Cached memory refers to data was read from the disk at some point and the memory manager left it up there in the off chance that it might be needed again. It'll get kicked very quickly if another process needs the memory.

    The second line and the swap line are what matters. You're showing over 4GB main RAM free and maybe 10% swap used. That side looks good.

    I'd be curious to see what your cpu utilization looks like during this. Can you run 'top' during a webadmin session and let us know what the top 3-5 processes running are, and their CPU utilization? I'd like to see what the CPU utilization is spiking to. Also, can you paste the results of the command 'uptime' after trying to access the objects?
  • Hi Team,

    Please find the attached required snaps , let me no if you need any thing else from my side [:)]
  • Hi Yagnesh,

    I hate to say this but I don't know what causes this.

    I recognize the symptoms tho, confd.plx & index.plx spike your CPU usage when running webadmin and especially when opening lists of definitions. In your case confd's maxing out one core with that one process so whatever that specific confd instance is doing, it's jammed until it finishes, and that exhibits like WebAdmin is hanging so you get the "Wait 30sec?" window comes up.

    I have two sites(120's) on 8.300 that exhibit this exact issue. As a routine matter of just running WebAdmin, my CPU usage spikes from normal range of around 30% to over 60% and occasionally spikes to 100% when opening lists of items.

    I have 80-90 items in my lists so nowhere near yours but also nowhere near the hardware as I'm on an Atom based platform. The cause? [:S]