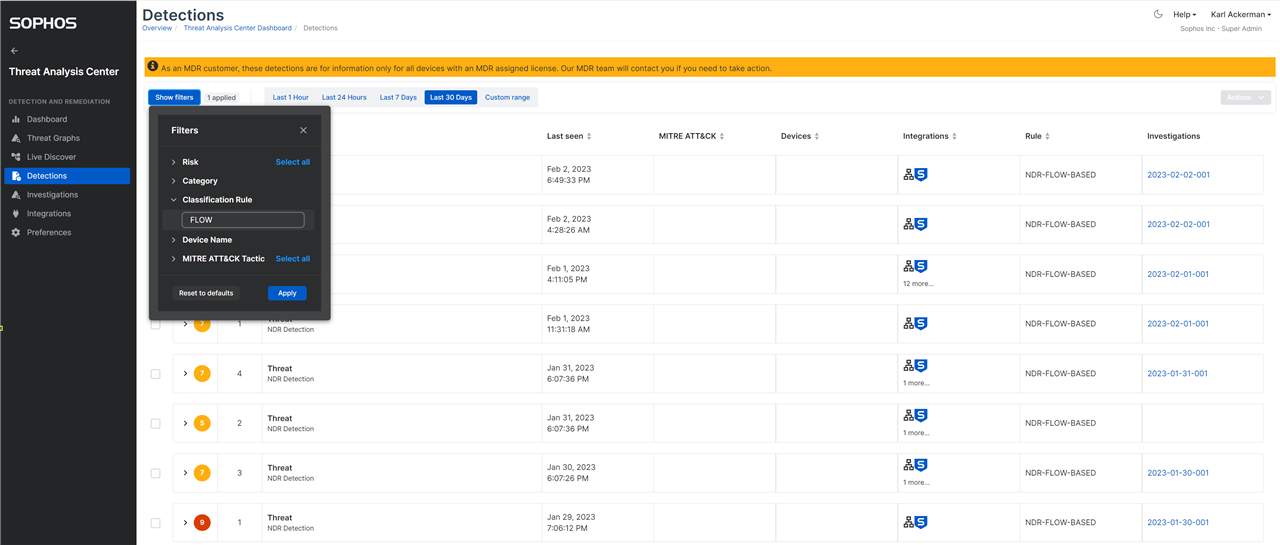
The Sophos Network Detection and Response performs analytics on network flows and will generate a detection in the Threat Analysis center when suspect activity is found. These detections can easily be reviewed by setting the Classification Rule filter to 'FLOW'. This will provide a list of all the detections that are based on the malware family machine learning model, IPS rules engine, domain generation ML model and flow analytics engine.
VIDEO on how to read FLOW detections:
Sophos NDR: Flow Based Detections
Viewing FLOW based detections in Central
Detections are given a score from 1 to 10 with 10 being the most suspect.
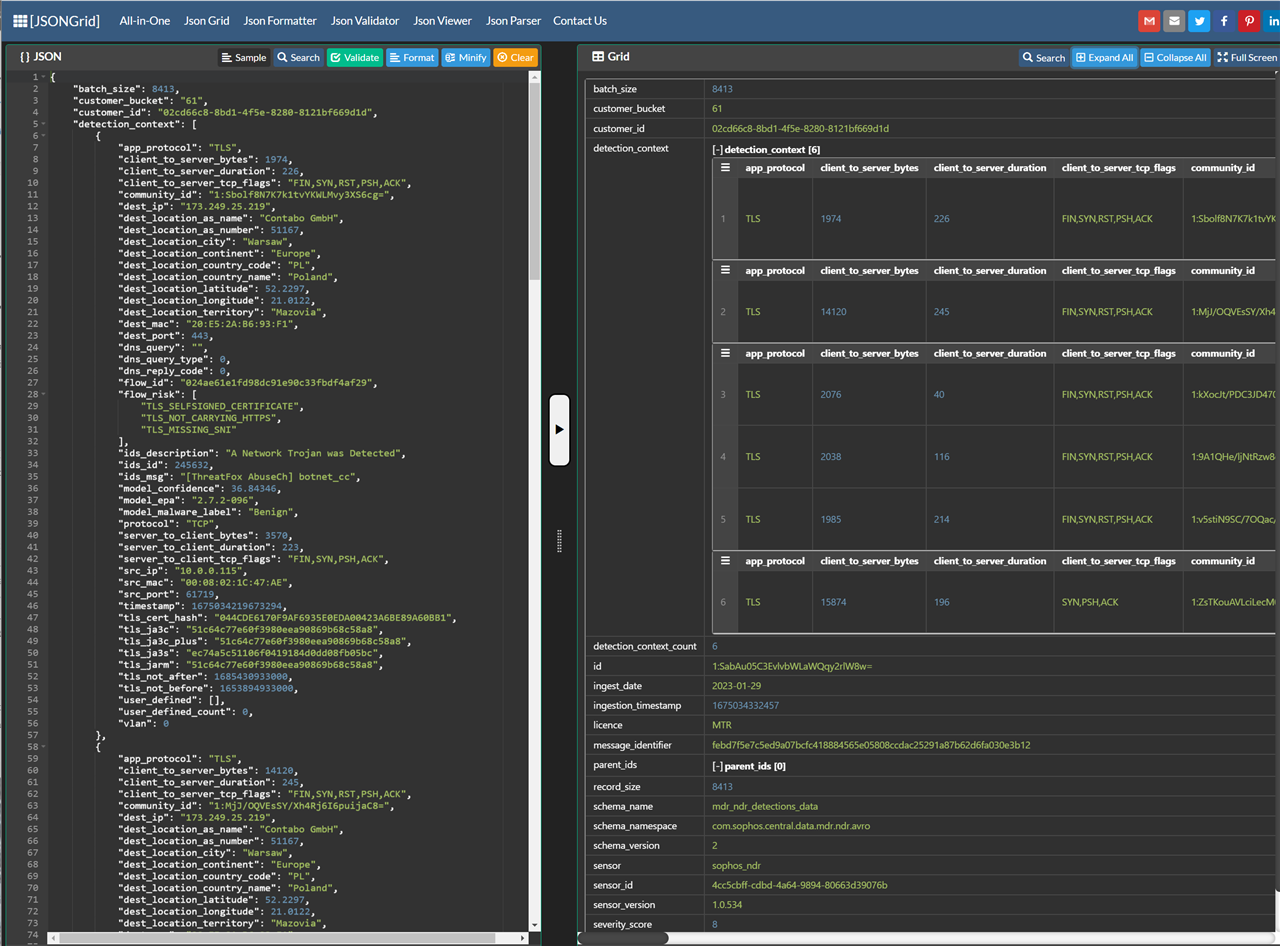
Information in these detections is contained in a JSON record format and can be difficult to interpret so I have added a set of new Live Discover reports (Queries) that can take the message ID contained in the detection record and present the detection in an easier to understand table view or optionaly as a human readable description of what was detected.
Live Discover Report - NDR - Detection Details (FLOW BASED) - Card view
Given the complexity of the JSON structure containing the details for the detection and because multiple detection algorithms have likely contributed to the over all score we have provided a Live Discover report or query that will process the information to provide a human readable report. You can load the following query into Live Discover and pivot from the Message_identifier field of the detection record to see the more easily understood results.
NDR - Detection details (FLOW Detection) Card view
With that report executed you will get result like what is shown below.
| Detection record details |
|---|
|
════════════════════════════════════════════════════════════════════════════════════════════════════════════════════════
|
|
Message ID: febd7f5e7c5ed9a07bcfc418884565e05808ccdac25291a87b62d6fa030e3b12 — This detection consisted of 6 network flow records.
|
|
Detection Date: 2023-01-29
|
 (ALERT) This was a (HIGH) severity 8 detection. An Investigation(Case) was created. (ALERT) This was a (HIGH) severity 8 detection. An Investigation(Case) was created. |
|
Geo Location of remote device: Contabo GmbH is located in Poland, in the city of Warsaw, Mazovia
|
|
(ALERT) The device is NOT Managed. MAC address: 00:08:02:1C:47:AE using IP Address 10.0.0.115 was communications were over TCP using the TLS application protocol. |
 (CAUTION) FLOW RISK: TLS_MISSING_SNI - TLS needs to carry the SNI of the remote server we’re accessing. Unfortunately SNI is optional in TLS so it can be omitted. In this case this risk is triggered as this is a non-standard situation that indicates a potential security problem or a protocol using TLS for other purposes (or a protocol bug). (CAUTION) FLOW RISK: TLS_MISSING_SNI - TLS needs to carry the SNI of the remote server we’re accessing. Unfortunately SNI is optional in TLS so it can be omitted. In this case this risk is triggered as this is a non-standard situation that indicates a potential security problem or a protocol using TLS for other purposes (or a protocol bug). |
|
(CAUTION) FLOW RISK: TLS_NOT_CARRYING_HTTPS - TLS only: this risk indicates that this TLS flow will not be used to transport HTTP content. Example VPNs use TLS to encrypt data rather to carry HTTP. This is useful to spot this type of cases. |
|
(CAUTION) FLOW RISK: TLS_SELFSIGNED_CERTIFICATE - TLS/QUIC only: this risk is triggered when a self-signed certificate is used. |
|
(ALERT) IDS Detection: A Network Trojan was Detected - [ThreatFox AbuseCh] botnet_cc ID: 245632 |
|
(INFO) EPA ML Analysis: Benign Probability: 36.84
|
|
(INFO) EPA ML Analysis: Benign Probability: 64.98
|
|
(INFO) EPA ML Analysis: Benign Probability: 59.11
|
|
(INFO) EPA ML Analysis: Benign Probability: 47.54
|
|
----- CLIENT 10.0.0.115 and SERVER 173.249.25.219 Communications -----
|
|
Client MAC address of 00:08:02:1C:47:AE at source IP: 10.0.0.115 communicated over the following ports: (61721, 61727, 61720, 61728, 61723, 61719)
|
|
Client to Server Coms: The client sent a total of 0.04(MB) to the destination server. Total communication time was 0 days and 00:00:00.001 (HH:MM:SS). Client to Server TCP Flags: (SYN,PSH,ACK,FIN,RST)
|
|
Destination MAC Address of 20:E5:2A:B6:93:F1 using destination IP 173.249.25.219 listening on port 443. No web hostname was identified
|
|
Server to Client Coms: The server sent a total of 1.06(MB) to the source client. Total communication time was 0 days and 00:00:00.001 (HH:MM:SS). Server to Client TCP Flags: (SYN,PSH,ACK,FIN)
|
The contents of the report will vary depending on what was detected, and the specific analytics performed on the flow data.
Record - Date - Severity
The top of the report will always have the detection message identifier, date, severity and if available the geo-location information of the remote device involved.
Device details
The next line is showing if source device was managed by central or is an un-managed device, we include information on the protocol and if the device was managed will show the device name, operating system details and logged on user.
Analytics models
Sophos NDR evaluates encrypted and un-encrypted network activity and runs a combination of analytics models on the data both as it is passing through the system and on completed network flows showing the entirety of the back and forth communication between a client and server. The detection results from this monitoring can lag the termination of the network flow by several minutes as the data is processed and because a conviction will often only be made when multiple flows have been observed as a cluster.
Flow Risk
The next section will have from 0 to many flow analytics notifications. These are cautions and indicate if the network flows had misconfigurations, were communicating over unexpected ports using self signed certs etc. These are contributing factors for other models.
IDS evaluation
You may see a section for IDS detection details. we evaluate the traffic vs a variety of 3rd party threat intelligence sources and when we find a match we provide that indicator
Encrypted Packet Analytics
You may also see a section for EPA (Encrypted Packet Analytics): The EPA model can be asked to evaluate a network flow record to determine the probability that the flow is benign activity, or matching a known malware family. When you see an indication that a flow is classified as Benign with some percentage it indicates that the flow did not correlate to any of the known malware families and the probability that the flow is simply normal activity. A low Benign probability score does not necessarily indicate malicious activity just that the flow does not match a malware family the model is aware of and does not match what we consider normal activity. It could be malicious or just an anomaly.
Domain Generation Algorithm Detection
The last of the ML Models shown is the DGA model. This is checking if we suspect the flow is associated to automatic domain generation. This score is the opinion of the model on the probability that DGA was used or not.
Client Server communication summary
The last section of the report provides some additional statistics on the client and server communications.
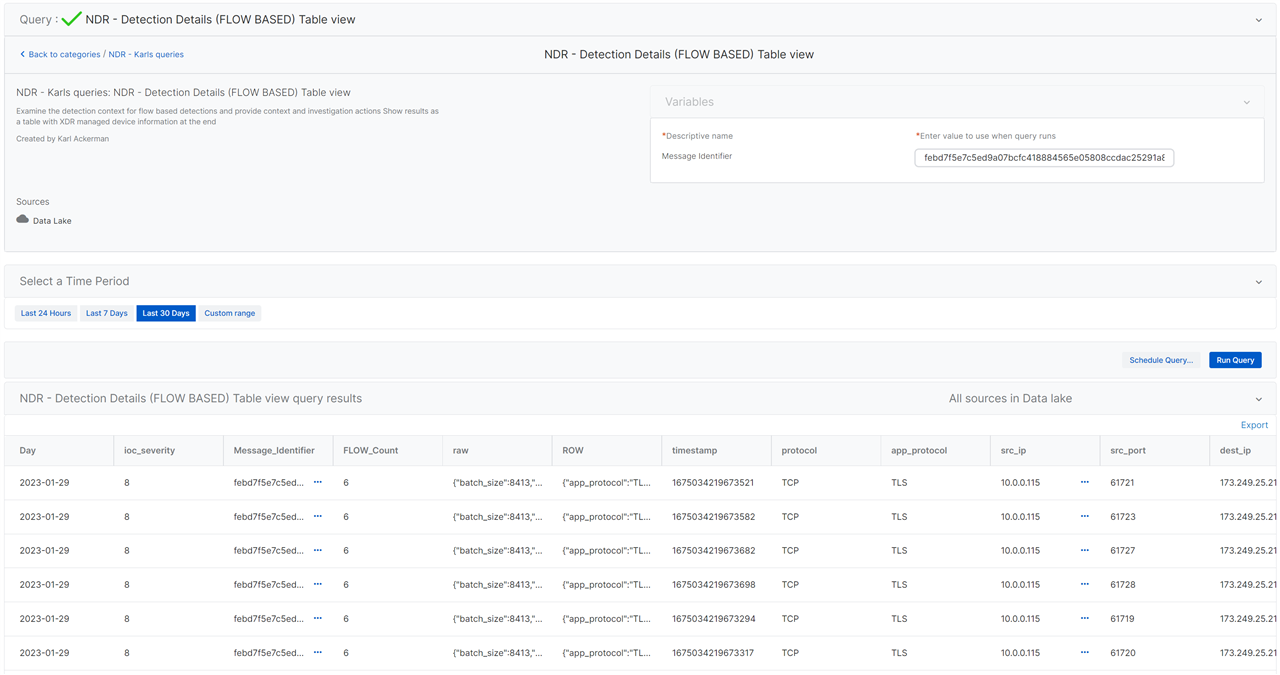
Live Discover Table view report
The Table view is most useful when reviewing all detection for a time range and for understanding the each flow record when a detection comprises multiple flows like in the example below.