

With the Sophos Network Detection and Response sensor deployed you are already getting notifications in the Detections console for malicious activity observed in the network flows. We have added a series of statistics reports to the NDR sensor in preparation for new dashboards that will be added by mid year. The information from these reports is being sent to the data lake and is accessible with Live Discover. Below I provide a dozen different Live Discover reports to help present the information. The reports cover everything from detection of un-managed assets to the classification of network flows by application protocol and new detections to identify web crawler activity.
New Live Discover Reports
| Report Name | Description | Source |
| NDR - Devices generating most network traffic | Detection for identifying the top 100 talkers on a network. Fields are ip: the private IP address of the machine, total_bytes: the total number of bytes sent or received by that ip, avg_pcr_payload: a value that desc | Data Lake |
| NDR - Devices generating most network traffic (BARS) | Detection for identifying the top 100 talkers on a network. Fields are ip: the private IP address of the machine, total_bytes: the total number of bytes sent or received by that ip, avg_pcr_payload: Producer consumer -1 pure download 1 pure upload | Data Lake |
| NDR - MAC IP correlation | Detection for identifying all the IP addresses associated with a given MAC address Excludes :: and 0.0.0.0 The query also checks for the MAC Address in the data lakes XDR Data to determine if the devices is managed or not. | Data Lake |
| NDR - Number of Monitored Hosts | Detection for identifying the number of private, public, and unknown hosts being monitored by | Data Lake |
| NDR - Protocl Report | Detection for identifying protocols used and how often NOTE: avg_pcr is the Producer Consumer Ratio (PCR) (-1 Pure Push to +1 Pure Pull) NOTE: mac_addresses is a list of the top 100 macs by total bytes in the monitored flows for the protocol | Data Lake |
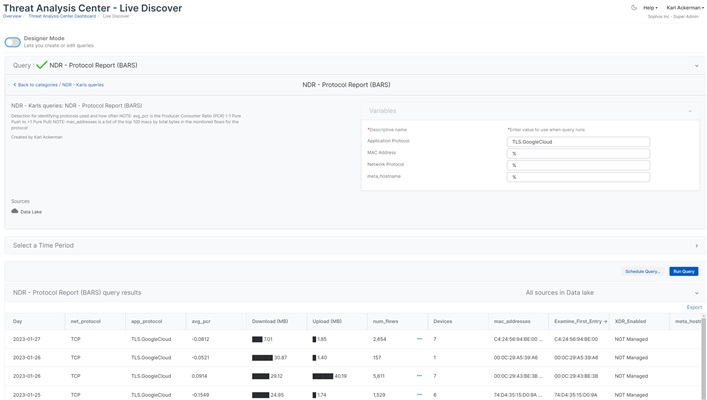
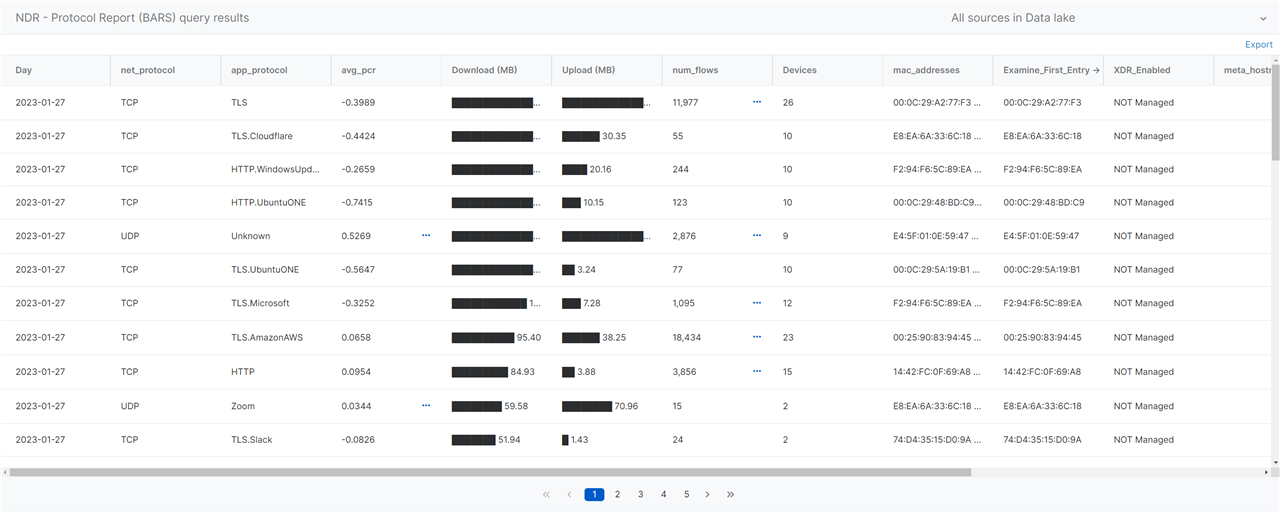
| NDR - Protocol Report (BARS) | Detection for identifying protocols used and how often NOTE: avg_pcr is the Producer Consumer Ratio (PCR) (-1 Pure Push to +1 Pure Pull) NOTE: mac_addresses is a list of the top 100 macs by total bytes in the monitored flows for the protocol | Data Lake |
| NDR - Raw record data | Display all fields for the NDR Detection or Report record. NOTE the interesting bits are in the 'raw' field. It is a JSON structure. The 'mapped_raw' is an array structure of the same. USE this query to view the raw field so it is easier to buil | Data Lake |
| NDR - Top 10 hosts for each protocol seen | Detection for identifying all used application protocols on the network and the top ten hosts using each | Data Lake |
| NDR - Top 100 most trafficked hostnames | Detection for identifying the top 100 most trafficked hostnames by traffic volume | Data Lake |
| NDR - Top 100 most trafficked hostnames (BARS) | Detection for identifying the top 100 most trafficked websites by traffic volume | Data Lake |
| NDR - Top Clusters | Detection for identifying the clusters with the most traffic in bytes. A cluster is a group of flows defined by their shared values for src_ip, dest_ip, dest_port, protocol, app_protocol | Data Lake |
| NDR - Top Clusters (BARS) | Detection for identifying the clusters with the most traffic in bytes. A cluster is a group of flows defined by their shared values for src_ip, dest_ip, dest_port, protocol, app_protocol | Data Lake |
| NDR -Mac IP Hostname Correlation | Source Mac IP and Hostname Correlation based on MDNS and NetBIOS NOTE: This includes hostname information extracted from the flow data where available. If no web_hostname was identified it will not be in the list | Data Lake |
| NDR Report with last execution time | List the available NDR reports and the most current report execution time | Data Lake |
VIDEO on Report creation
This video covers how to add the above reports to Sophos Central Live Discover
NDR Device Detection Engine Reports
These reports will be added as an update this winter and will be available in Feb/March as a new NDR category under the Threat Analysis Center - Live Discover. For those that want to access and use them now you will need to import each report by hand.
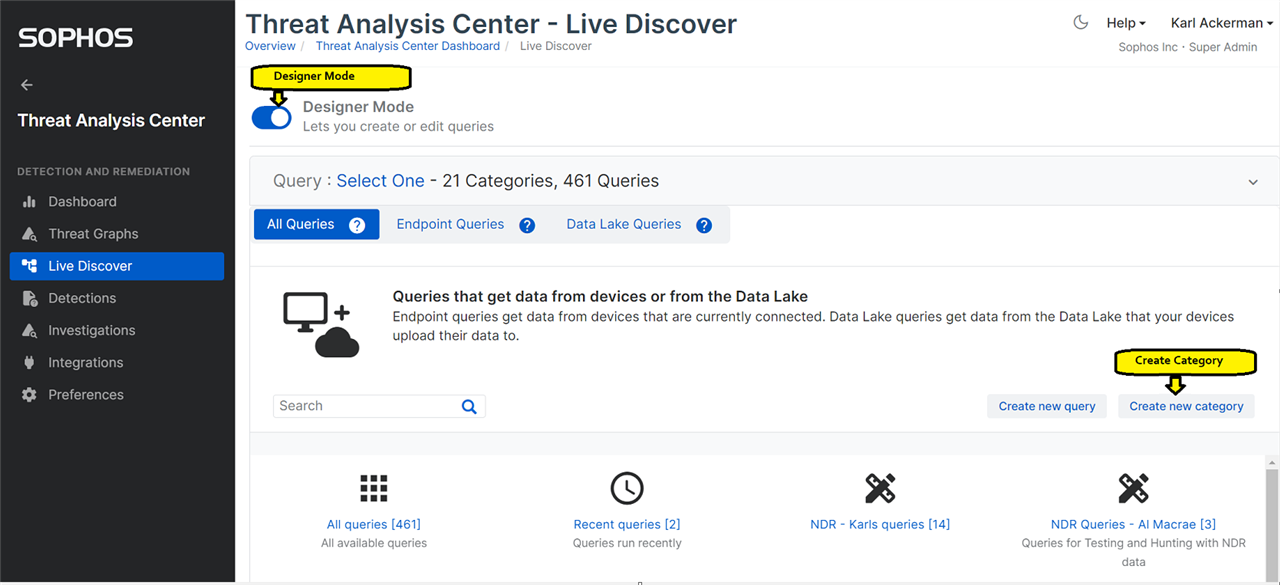
Create a new Category
First you will want to flip the 'Designer mode' toggle in Live Discover, then select 'Create new category', Call the category 'NDR'
Attached is a ZIP file with the 14 reports listed above. Each of the files includes the report name, description, category source information and the SQL Syntax to generate the report. You will want to add each of these to the data lake.
The contents of each file is VALID SQL Code and can be directly copied to the SQL Section when creating a new query.
-- QUERY NAME:    NDR Report with last execution time
-- CATEGORY:      All queries, NDR
-- DESCRIPTION:   List the available NDR reports and the most current report execution time
-- SOURCE:        Data Lake

-- VARIABLE       $$Report Name$$ STRING

SELECT DISTINCT
   CASE
      WHEN CAST(JSON_EXTRACT(raw, '$.type') AS VARCHAR) = CAST('1' AS VARCHAR) THEN 'Detection Severity: ' || CAST(JSON_EXTRACT(raw,'$.severity_score') AS VARCHAR)
      WHEN CAST(JSON_EXTRACT(raw, '$.type') AS VARCHAR) = CAST('2' AS VARCHAR) THEN CAST(JSON_EXTRACT(raw, '$.name') AS VARCHAR)
      ELSE 'UNKNOWN'
   END Report_Name,
   ioc_detection_description,
   CASE
      WHEN CAST(JSON_EXTRACT(raw, '$.type') AS VARCHAR) = CAST('1' AS VARCHAR) THEN 'FLOW_DETECTION'
      WHEN CAST(JSON_EXTRACT(raw, '$.type') AS VARCHAR) = CAST('2' AS VARCHAR) THEN 'DDE_REPORT'
      ELSE 'Unknown Type: '||CAST(JSON_EXTRACT(raw, '$.type') AS VARCHAR)
   END Report_Type,
   COUNT(*) Instances,
   MAX(CAST(JSON_EXTRACT(raw, '$.ingest_date') AS VARCHAR)) Last_run
FROM mdr_ioc_all
WHERE ioc_worker_id = 'worker_ndr'
   AND CASE
      WHEN CAST(JSON_EXTRACT(raw, '$.type') AS VARCHAR) = CAST('1' AS VARCHAR) THEN LOWER('Detection Severity: ' || CAST(JSON_EXTRACT(raw,'$.severity_score') AS VARCHAR)) LIKE LOWER('%$$Report Name$$%')
      ELSE LOWER(CAST(JSON_EXTRACT(raw, '$.name') AS VARCHAR)) LIKE LOWER('%$$Report Name$$%')
   END
GROUP by 1,2,3
ORDER By 5 DESC, 1 ASC
Create a new Query
You will select Create Query from the Threat Analysis Center Live Discover page and set the query name, assign it to the new NDR category, provide a description and ensure you set the source to data lake.
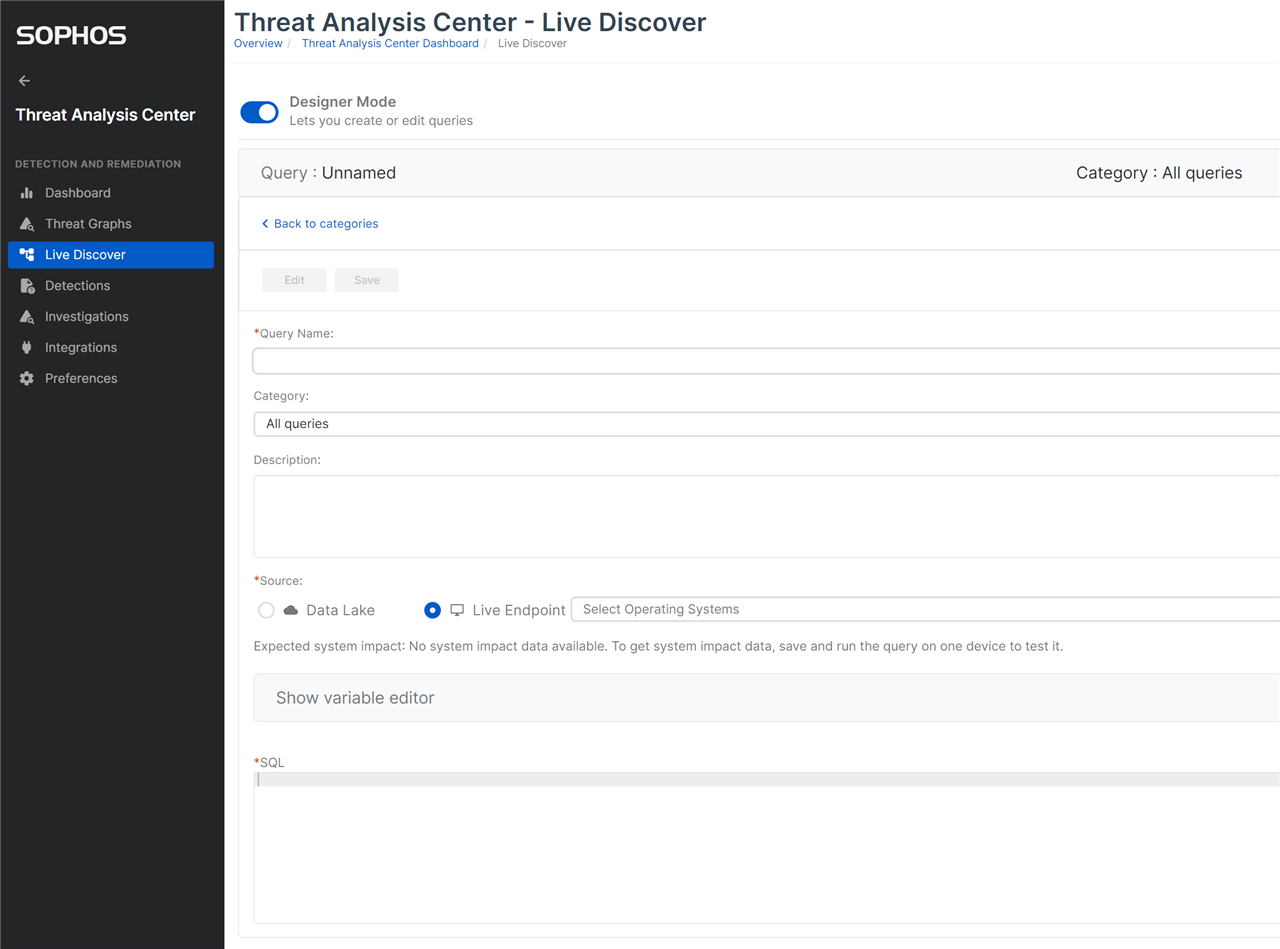
Most queries also include variables that will need to be added, ensure you set the variable type as specified, this will enable pivoting from results in other reports to the new NDR report
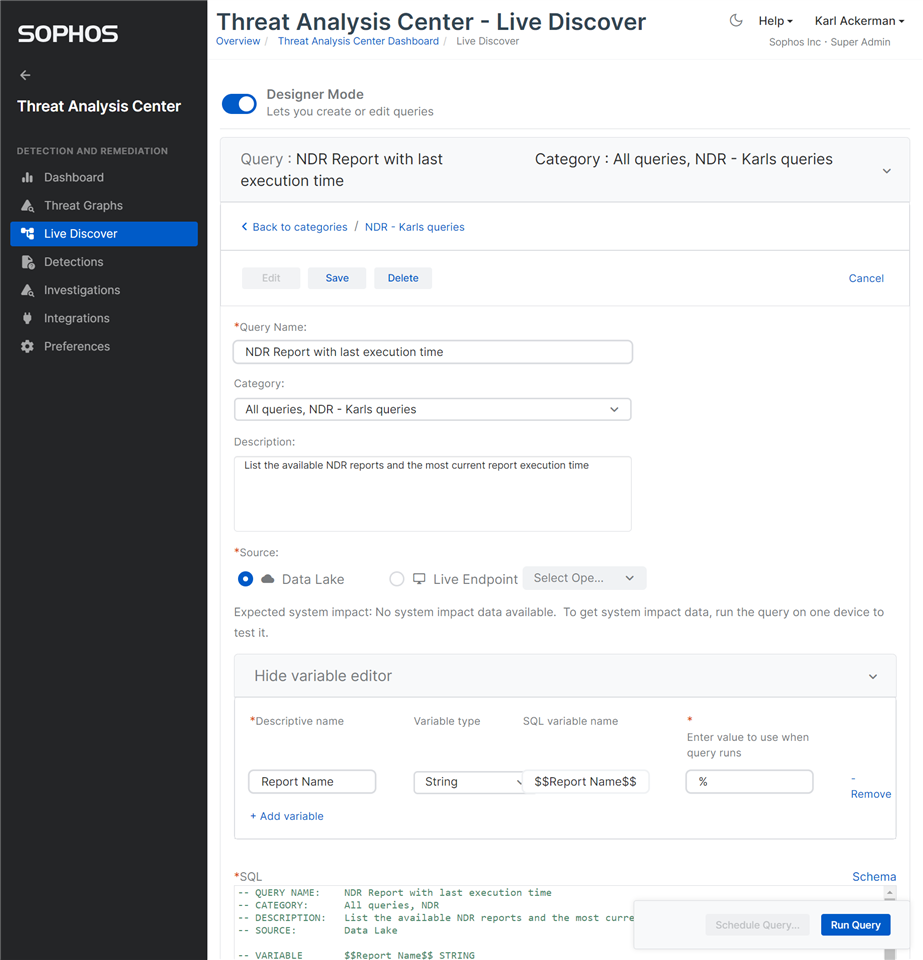
Run and Save
With the new report (Query) entered you can run it and view results. Once everything is working save the edits
Please see the queries section of the NDR Community forum for information on each of the new reports and how to use it to gain insight into the activity in your environment or simply explore on your own by adjusting the time range for the query execution and the variables. These reports will allow things like understanding the most visited hostnames, or exploring application protocols for a given device in your network.
VIDEO on how to setup and run NDR Reports
NDR Device Detection Engine Reports
We will be adding each of the reports directly to central in Feb/March. for those looking to use the reports now you can follow the instructions in this brief video to add the reports directly to central.