

Note: Beta has been enabled and is now available to all XDR customers on June 12, 2023.
We are pleased to announce the availability of the new beta version of the Threat Analysis Center Dashboard. XDR customers can now try several exciting enhancements by enabling the "Beta dashboard" toggle within the existing Threat Analysis Center Dashboard page. Multiple new interactive data visualizations focus on providing actionable data to increase efficiencies.
Feature summary:
 7 new visualizations (widgets) + plus multiple widget views
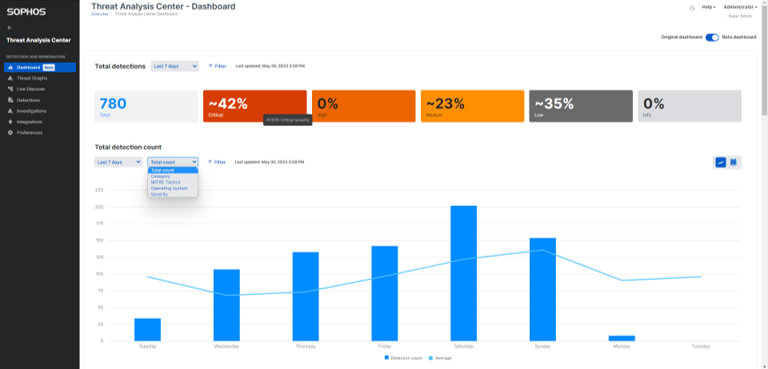
- Total detections
- Total detection count (includes 5 views)
- Top 10 entities (includes 2 views)
- Top 10 users
- Sensor location of detection
- MITRE TTP
- Recent detections
- Interact with each widget by:
- Filtering by relevant attributes
- Adjusting time ranges
- Context-aware click-throughs that open in separate browser tabs
About the beta stage:
The "Beta" stage means we are still under development, and we still have some items to wrap up over the next few weeks.
Known limitations during beta:
| Issue ID | Description |
| CPLAT-42707 | The initial versions of the dashboard will be available in English only. Standard language support will be available later this summer. |
| SPUI-2238 | Graph and table click-throughs will not load the Detection page for Helpdesk & Read Only user roles. |
| CPLAT-49236 | Top 10 entities by entity widget shows double trend indicator |
| CPLAT-48428 | Widget facet filter requires additional styling |
| CPLAT-47709 | Filter button placement varies in different widgets. |
| CPLAT-47811 | Table widget column sorter icon spacing is too far from the header label. |
Documentation:
What do you need to do?
The beta dashboard is now visible to all accounts with an XDR license. No opt in is required. The Dashboard left navigation menu now has a "Beta" label, and you will see the ability to stay on the original dashboard or change to the beta dashboard on the Dashboard page itself. You can toggle back and forth between the options as needed.
Reporting feedback:
For items encountered during the beta that are not already listed as a known limitation, please provide the detail of the issue being faced by commenting on this post.
What else to know?
- Some terminology changes have been made to the Detections page and associated filters. The dashboard widgets and filters use the new terminology as well. Key changes are:
- "Device name" will now be "Entity"
- "Device type" will now be "Entity type"
- "Category" will now be "Type"
- "Integrations" will now be "Category"