

We are pleased to announce the General Availability of our new Threat Analysis Center Dashboard. Our new Dashboard includes multiple new interactive data visualizations (widgets) focused on providing easy access to actionable data to increase efficiencies. All widgets include context-aware click-throughs taking you directly to the pre-filtered detection detail.
The original Threat Analysis Center Dashboard will remain available through on-page UI toggle until localization of the new dashboard is completed.
Feature summary:
- 7 new visualizations (widgets) + plus multiple widget views
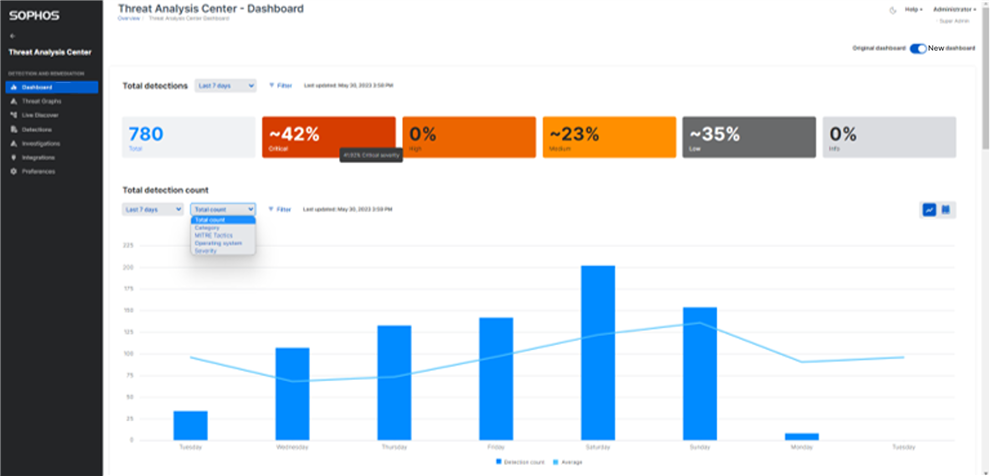
- Total detections
- Total detection count (includes 5 views)
- Top 10 entities (includes 2 views)
- Top 10 users
- Sensor location of detection
- MITRE TTP
- Recent detections
- Interact with each widget by:
- Filtering by relevant attributes
- Adjusting time ranges
- Context-aware click-throughs that open in separate browser tabs
Documentation:
What else to know?
- Some terminology changes have been made to the Detections page and associated filters. The dashboard widgets and filters use the new terminology as well. Key changes are:
- "Device name" will now be "Entity"
- "Device type" will now be "Entity type"
- "Category" will now be "Type"
- "Integrations" will now be "Category"
