This discussion has been locked.
You can no longer post new replies to this discussion. If you have a question you can start a new discussion

High httpproxy memory usage with 9.713 and 9.714

Hello,

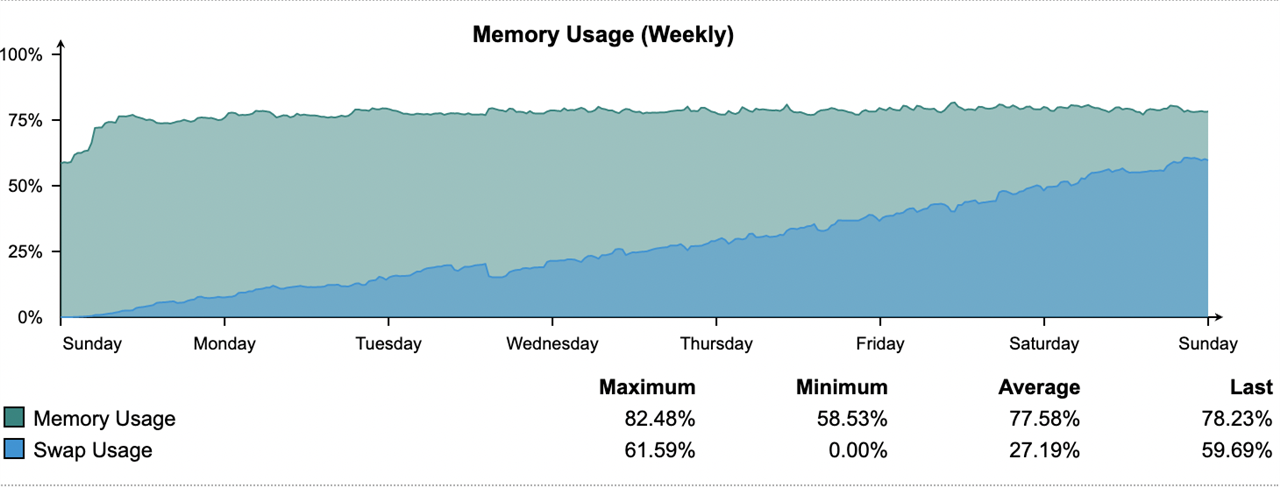
I have a pair of virtual UTMs which have run for years with about 4G of RAM allocated to them. After the upgrade from 9.712 to 9.713 in Nov I noticed my swap usage climbing beyond its normal 10-15% level. The culprit was the httpproxy proces so I added about 1/2G to the VMs which returned the swap usage to about 15%. This past week I updated to 9.714 and observed the httpproxy process growing much larger driving swap usage into the 60% range.

The two systems run with almost identical configurations which change very little over time. Our usage patterns have not changed much either. I have not noticed anything in the release notes suggesting a significant change that should require more memory, so my suspicion at this point is that the httpproxy process has a memory leak.

The graph below shows 9.714 after a restart last week. Here is the current httpproxy memory/swap usage:

  PID USER      PR  NI  VIRT  RES  SHR S   %CPU %MEM    TIME+  SWAP COMMAND                                                                                                      
 4776 httpprox  20   0 6202m 1.6g 3996 S      1 38.4  46:09.01 4.4g httpproxy
                                                                                                     

--Larry


This thread was automatically locked due to age.
Parents
  • I had the same problem on our SG115 UTM wiht 4GB Memory inside. After a reboot it takes a longe time, 10-20 day to get the swap to 70%,
    really bad for the machine performance and the SSD.

    I exchanged the SODIMM to a 8GB Module today and everything is fine.

    And more, before and long time before also alway some level of swapping happend. 10-20%. Now, no swapping. So i can strongly recommand to upgrade to 8GB

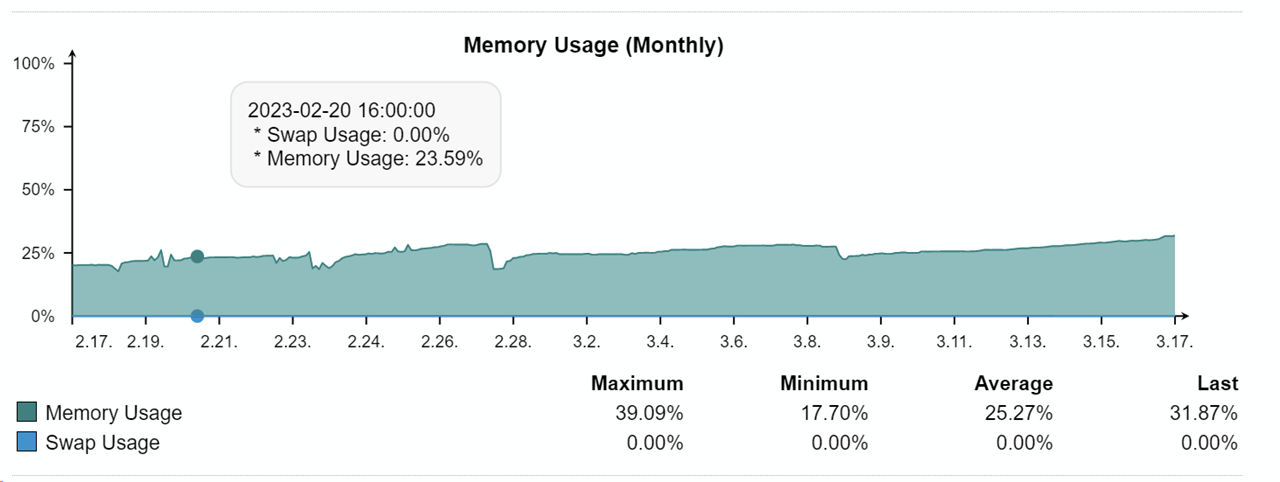
  • That's some crazy swap usage.  I tried 8GB too, but was seeing small amounts of swap usage after a week or so. Bumping it up to 16GB eliminated that entirely.

    It's interesting how it slowly ramps up.  I think the http proxy has a memory leak of some sort.  If I stop the proxy and restart, it will reset the ramp.

    Edit: Killing the web filtering drops the ram usage from 32% to 15%!  The filtering is just url, no caching or anything.

  • Yep, I noticed that as well. It looks like a memory leak & thus part of why I started this thread.

    In my case, adding memory isn't really a good option, so I've added the following work-around to restart the process once it grows past 3GB:

    Add to /etc/crontab-static:

    # Kill httpproxy when it grows too large

    03 * * * * root mem=`ps ax -o vsz,cmd|grep -v grep|grep httpproxy|awk '{print $1}'`;if [[ $mem -ge $((3*1024*1024)) ]];then kill `ps ax -o pid,cmd|grep -v grep|grep httpproxy|awk '{print $1}'`; fi

    The process is restarted once the system notices that it's missing, which happens fairly quickly.

    To get the changes added to the running crontab, make a change in the UI. For example, Management / Up2Date / Configuration / Pattern download interval

    --Larry

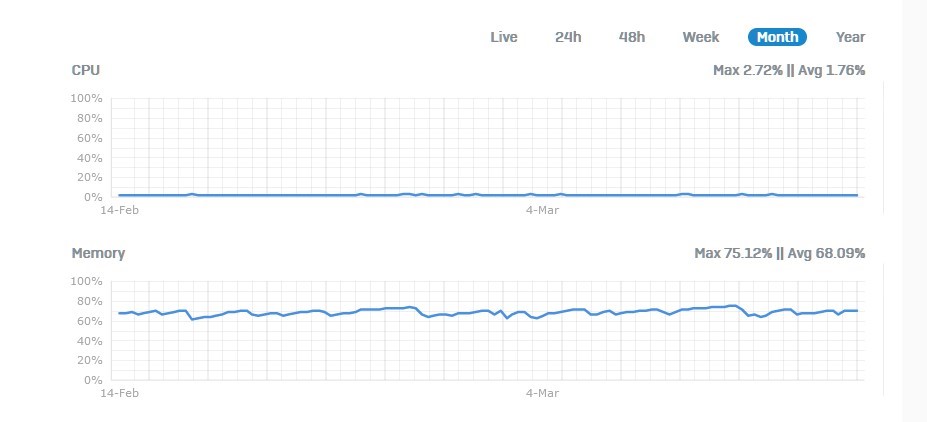
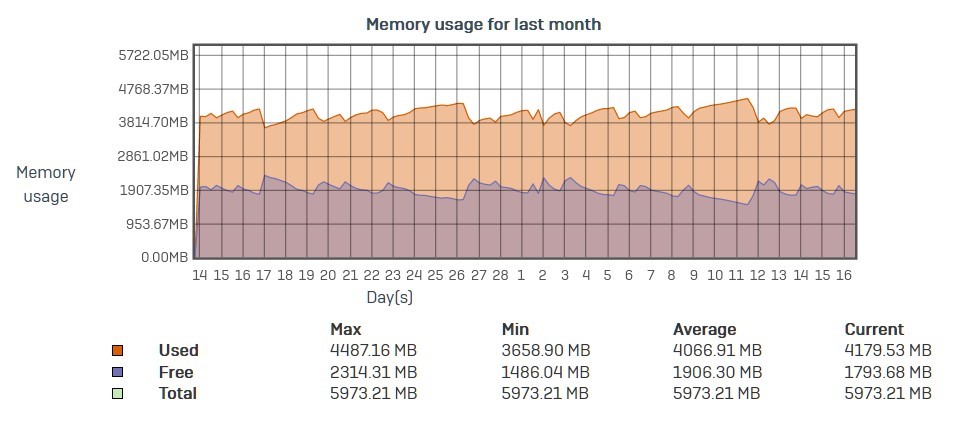
  • Here is a comparison with XG.  Keep in mind, the hardware limitation, even though I have 16GB of memory, I can only use 6GB.  Memory usage should be increased for home use license for XG, IMO.  CPU I think is fine, but this is scary usage.

    OPNSense 64-bit | Intel Xeon 4-core v3 1225 3.20Ghz
    16GB Memory | 500GB SSD HDD | ATT Fiber 1GB
    (Former Sophos UTM Veteran, Former XG Rookie)

  • Yes, maybe its a memory leak. I installed now, after the 8GB the 9.715-3 update. I will wait for some weeks now and report how it goes with memory and swap usage

Reply Children
No Data