XG125, SFOS 18.0.5 MR-5-Build586
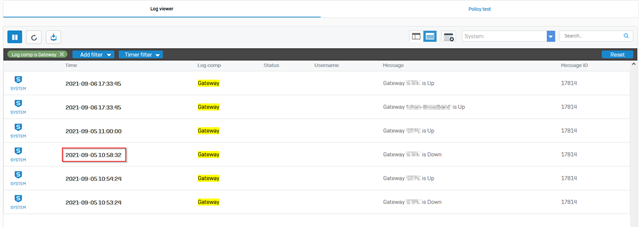
We have redundant ISPs at a site. Email notifications reveal that one of the ISPs drops frequently, though briefly. The email notifications are sent once per minute, so we don't really know the exact time or duration of the drops. And it's cumbersome to assemble a report in Excel from the emails to present to the ISP.
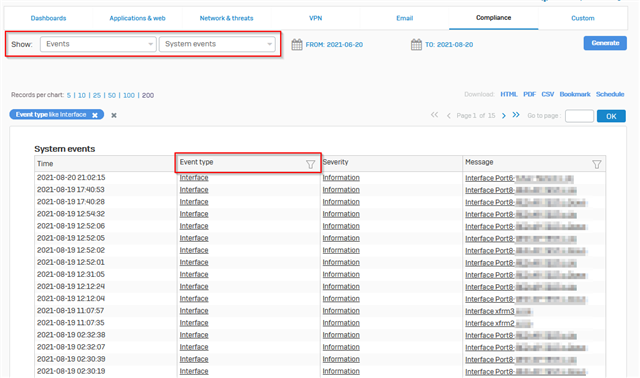
I looked for a report that would give me more granular information but didn't manage to find it. Is there a canned report that shows connection drops at each of the WAN interfaces? Is there a way to build a custom report for this? Looking for exact time and duration.
Thanks!
Hi Jeff Vandervoort,
Thank you for reaching out to Sophos Community.
You can filter out interface events from Reports > Compliance, Show: Events | System evenets
Select the date range as required and…
Select the date range as required and filter 'Event type' with Interface.
Thanks, Yash! That's exactly what I needed.
I'm a bit puzzled, though...I have email notifications for outages that the report does not include. I set the report criteria exactly as you did, except the date range is one month. The report is missing several outages reported by email notifications across several days.
I guess you have received few gateway up/down events for said WAN interface.
Try filtering 'Event type' with gateway as well.
Yes, Gateway shows me all of the email notifications I've received. So I guess I was asking for the wrong thing. But why do Interface and Gateway show me different results?
Also puzzled that these drops are all about 20 seconds...yet they have a VOIP phone system that's in near-constant use, and I've not had any reports of dropped calls or not being able to get a dial tone. Any ideas on that?
Firewall generates gateway UP/Down events when the failover condition configured in IPv4 gateway(Under Interface > WAN link manager) fails. Interface UP/Down events are generated if the physical link goes UP-DOWN.
I would suggest checking the failover rule in IPv4 gateway. Change the default criteria and test ping/tcp connection with any external IP address(8.8.8.8/4.2.2.2/1.1.1.1) instead of the ISP gateway IP.
It's set to 1.1.1.1. The ISP gateway IP almost never goes down, even if the connection is down, so I always change that to ping external hosts. Also, there are no failovers associated with these notifications.
Yash, any comments on the discrepancy?
I'd suggest checking dgd.log events to get more information on the reported issue.
==> Filter out 'Gateway Down' event timestamp from log viewer/reports.
Here is a sample snapshot:
Timestamp: 2021-09-05 10:58:32
==> Filter dgd.log file with below command.
# cat /log/dgd.log | grep -i "Sep 05 10:58"
==> Here is a sample example to understand Ping Success/Fail event.
Ping status: S/F | S: Success | F: Fail
Ping : S=============================================
DEBUG Sep 07 09:27:48 [11705]: Initiating Ping : <GATEWAY_IP>
DEBUG Sep 07 09:27:48 [11705]: GW (ISP_GW,Port5) : Waiting for reply
DEBUG Sep 07 09:27:48 [11705]: Success, Retrying(1) Ping : <GATEWAY_IP>DEBUG Sep 07 09:27:48 [11705]: GW (ISP_GW,Port5) : Waiting for replyDEBUG Sep 07 09:27:48 [11705]: Current Status : Live
DEBUG Sep 07 09:27:48 [11705]: Ping Result for : <GATEWAY_IP>DEBUG Sep 07 09:27:48 [11705]: Ping : SDEBUG Sep 07 09:27:48 [11705]: Current Status [GW(ISP_GW,Port5)] : LiveDEBUG Sep 07 09:27:48 [11705]: Sleep for 60 Seconds
=============================================
Ping : F=============================================
DEBUG Aug 16 18:08:44 [12387]: Initiating Ping : <GATEWAY_IP>
DEBUG Aug 16 18:08:44 [12387]: GW (ISP_GW,Port5) : Waiting for reply
DEBUG Aug 16 18:08:46 [12387]: Failed, Retrying(1) Ping : <GATEWAY_IP>DEBUG Aug 16 18:08:46 [12387]: GW (ISP_GW,Port5) : Waiting for replyDEBUG Aug 16 18:08:46 [12387]: Current Status : Live
DEBUG Aug 16 18:08:48 [12387]: Failed, Retrying(2) Ping : <GATEWAY_IP>DEBUG Aug 16 18:08:48 [12387]: GW (ISP_GW,Port5) : Waiting for replyDEBUG Aug 16 18:08:48 [12387]: Current Status : Live
DEBUG Aug 16 18:08:50 [12387]: Failed, Retrying(3) Ping : <GATEWAY_IP>DEBUG Aug 16 18:08:50 [12387]: GW (ISP_GW,Port5) : Waiting for replyDEBUG Aug 16 18:08:50 [12387]: Current Status : Live
DEBUG Aug 16 18:08:52 [12387]: Failed, Retrying(4) Ping : <GATEWAY_IP>DEBUG Aug 16 18:08:52 [12387]: GW (ISP_GW,Port5) : Waiting for replyDEBUG Aug 16 18:08:52 [12387]: Current Status : Live
DEBUG Aug 16 18:08:54 [12387]: Failed, Retrying(5) Ping : <GATEWAY_IP>DEBUG Aug 16 18:08:54 [12387]: GW (ISP_GW,Port5) : Waiting for replyDEBUG Aug 16 18:08:54 [12387]: Current Status : Live
DEBUG Aug 16 18:08:56 [12387]: Ping Result for : <GATEWAY_IP>DEBUG Aug 16 18:08:56 [12387]: Ping : FDEBUG Aug 16 18:08:56 [12387]: Current Status [GW(ISP_GW,Port5)] : DeadDEBUG Aug 16 18:08:56 [12387]: Sleep for 60 Seconds
NOTICE Aug 16 18:08:56 [12387]: Actiontree, Live to DeadNOTICE Aug 16 18:08:56 [12387]: Actiontree, executing: Live_To_Dead @ISP_GW
DEBUG Aug 16 18:08:56 [962]: Executing Service : <gateway:gw_live_to_dead> args : <{"param":"@ISP_GW"}>
Note: <GATEWAY_IP> is the IP address kept in the failover rule condition of IPv4 gateway(Network > WAN link manager).