

With the v18, a lot of features and improvements have been made. Kudos to the devs team and the PM. The following improvements are very nice:
- UI is faster than before (once the Control Center has terminated to refresh all gadgets and graphs)
- DPI. It is still not mature but a nice step forward
- Radius timeout
- Enterprise NAT
- SD-WAN policies
- and many other things
but dear Devs and PM, logging and reporting is still poor, very poor. Take a coffee and follow me:
- drop-packet-capture command: the commands, for each packet, takes at least 9 lines on a 13" screen. See the example: console> drop-packet-capture
2020-02-24 08:27:15 0102021 IP 94.177.193.151.443 > 192.168.1.101.58612 : proto TCP: R 1337150070:1337150070(0) checksum : 19633
0x0000: 4500 0028 ed0b 4000 3406 776e 5eb1 c197 E..(..@.4.wn^...
0x0010: c0a8 0165 01bb e4f4 4fb3 4a76 0000 0000 ...e....O.Jv....
0x0020: 5004 0000 4cb1 0000 P...L...
Date=2020-02-24 Time=08:27:15 log_id=0102021 log_type=Firewall log_component=Invalid_Traffic log_subtype=Denied log_status=N/A log_priority=Alert duration=N/A in_dev=Port2 out_dev= inzone_id=0 outzone_id=0 source_mac=74:da:da:f4:18:6f dest_mac=00:e0:b6:14:b4:21 bridge_name= l3_protocol=IPv4 source_ip=94.177.193.151 dest_ip=192.168.1.101 l4_protocol=TCP source_port=443 dest_port=58612 fw_rule_id=N/A policytype=0 live_userid=0 userid=0 user_gp=0 ips_id=0 sslvpn_id=0 web_filter_id=0 hotspot_id=0 hotspotuser_id=0 hb_src=0 hb_dst=0 dnat_done=0 icap_id=0 app_filter_id=0 app_category_id=0 app_id=0 category_id=0 bandwidth_id=0 up_classid=0 dn_classid=0 nat_id=0 cluster_node=0 inmark=0x0 nfqueue=0 gateway_offset=0 connid=0 masterid=0 status=0 state=0, flag0=0 flags1=0 pbdid_dir0=0 pbrid_dir1=0
Too long, too much lines. So, in my opinion, you could remove all the variables that are =0; print in a different colour source_ip, destination_ip and dest_port; zone id should report the name and not the ID. You need to run a sql command to find the corresponding ID, really? I have already some customers with 4 additional zones and troubleshooting with drop-packet-capture is impossible as the customer has tracked in notepad zone_id=zone name; in_dev and out_dev= please report here the interface name and not the Port number (same reason as the previous point). - Web exceptions: try this exercise. Install skype on your computer and try to understand which are the domains to allow only from the logging. A nightmare! To understand why XG was blocking file trasfer via skype, I went to another brand to understand which domains to unlock. On pure XG logging, live logs does not report nothing; drop-packet-capture not all the domains; tcpdump you get mad with such connections;
- Please separate logs for VPN, Wi-Fi, DHCP, DNS requests (at least). Everything is inside SYSTEM. A mess. You can use filters, ok, but it is not straightforward for many customers. You expect to have VPN logs and not SYSTEM, filters inside the component.
- Still many linux command lines tools to use. Conntrack for example.
- Ability to put services in debug mode via UI
- Ability to understand from the UI what each service does. For example, to troubleshoot WAF, the service is reverseproxy, so in the UI (once we can put all services in debug mode, please add a column with specification or details like: this services allows you to get more information for WAF module.
- Ability to search logs based on time range and not only last 10 minutes and so on
- Customized Control Center: one of the most request I received is:How can I understand the current bandwidth utilization from Control Center? This is a basic feature
- Proper logging when you cannot delete the objects (Where they are used is a good help)
- Proper logging for CA and Certificate upload issue.
Reporting:
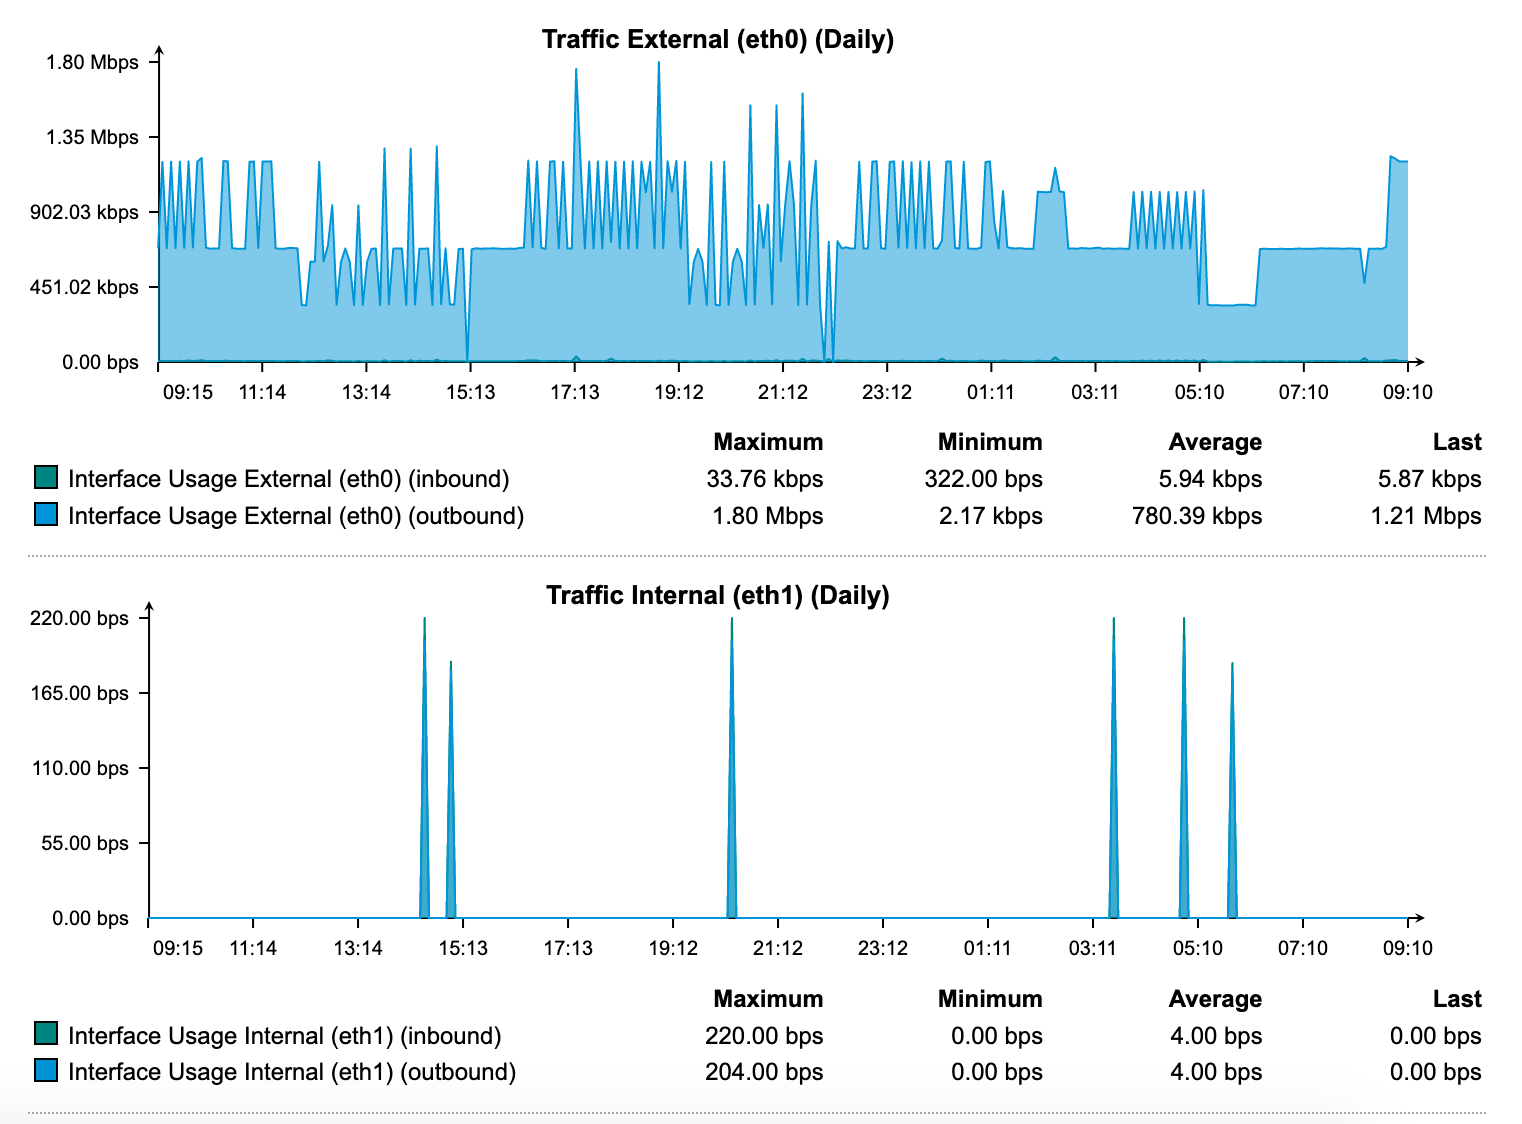
- report based on zone and on port. We need to find bytes sent/received per interface and per zone and not only per firewall ID. Like this:

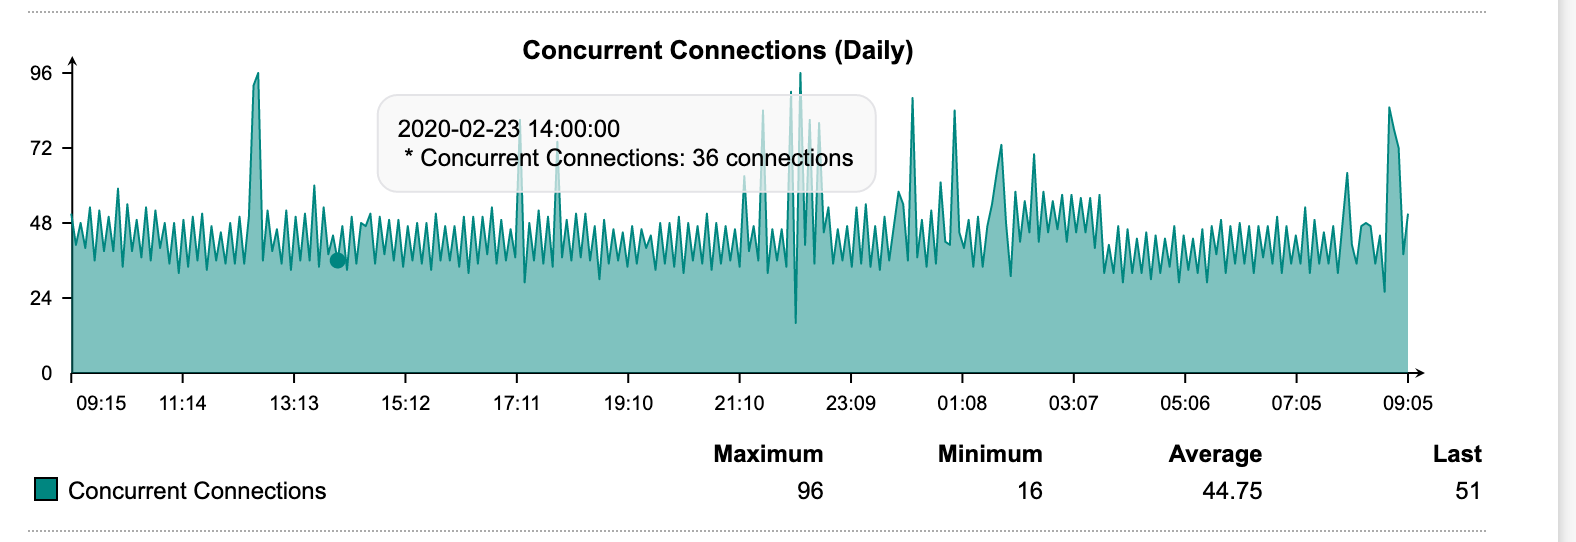
- Concurrent connection list. This is a straightforward report to compare and understand anomalies in the network.

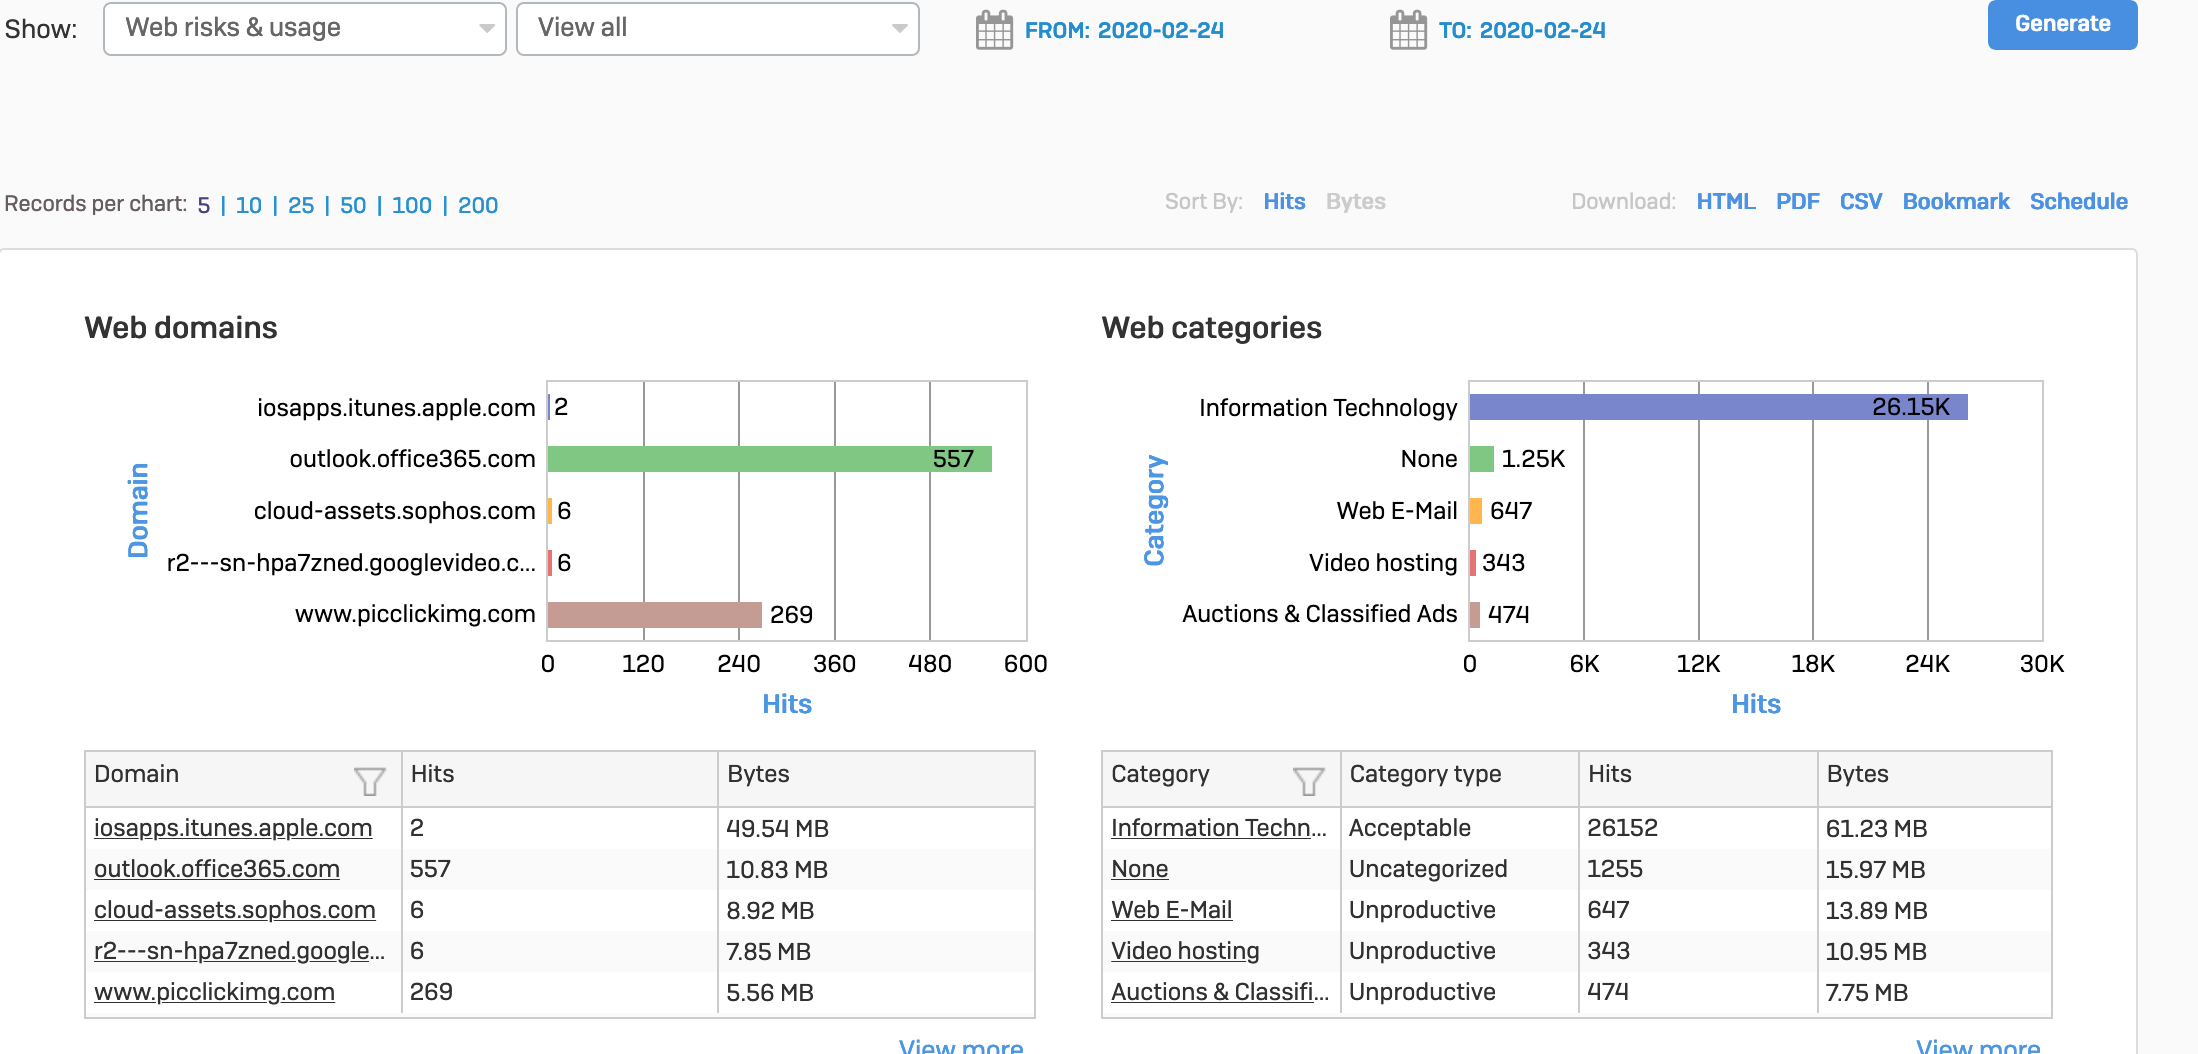
- Web usage report. Now you cannot have graphs per Bytes (even if you select sort by: byte)

This thread was automatically locked due to age.
