Important note about SSL VPN compatibility for 20.0 MR1 with EoL SFOS versions and UTM9 OS. Learn more in the release notes.

This discussion has been locked.
You can no longer post new replies to this discussion. If you have a question you can start a new discussion

Real Bandwidth usage - Control Center which one is correct?

Hi All,

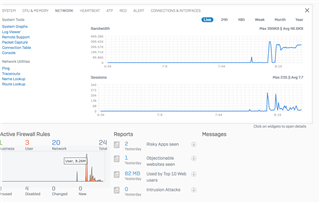
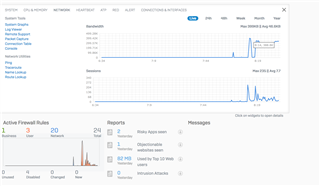
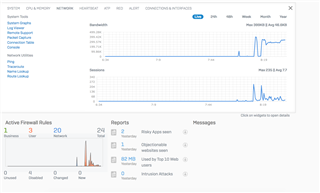
After years of XG usage, I still cannot understand in the CC which graph is the correct one. I only have one user role and look at the graphs that CC reports:

Looking at the command line output:

system diagnostics utilities bandwidth-monitor

it reports like "bandwidth graph". I have a 100Mb at home and I never reach more than 8 Mb behind XG. Yes I know about IPS, Web Proxy and Anti-malware scanning but graphs are not reporting correct information at all. This is the feeling I have.

What about other guys on Community?

Regards


This thread was automatically locked due to age.
Parents
  • Hi Luk,

    I only rely on the graphs shown in Diagnostics -> System Graphs, they are pretty accurate.

    Also, I feel that the bandwidth graphs in the CC are in BYTES when we are used to mesure bandwidth in BITS. So, when you should see 100 Mb, you will see only 12 MB (with uppercase B).

    Example :

    81Mbps at 17:01


    10.03 MBps at 17:01, which is consistent


    Regarding the "Active Firewall Rules" graph, I really don't understand it.

  • Hi,

    you ned to be careful how you interpret some of those graphs. I have two external gateways and the graphs appear to have them reversed. One has a 1gb interface and shows 4.5mb/s where as the other has a 100mb interface and shows 1gb/s.

    Also the memory graphs labels need to be changed, the total needs to say total configured, because in two out of the three columns it is not the total of the two lines above.

    Ian

    XG115W - v20.0.3 MR-3 - Home

    XG on VM 8 - v21 GA

    If a post solves your question please use the 'Verify Answer' button.

Reply
  • Hi,

    you ned to be careful how you interpret some of those graphs. I have two external gateways and the graphs appear to have them reversed. One has a 1gb interface and shows 4.5mb/s where as the other has a 100mb interface and shows 1gb/s.

    Also the memory graphs labels need to be changed, the total needs to say total configured, because in two out of the three columns it is not the total of the two lines above.

    Ian

    XG115W - v20.0.3 MR-3 - Home

    XG on VM 8 - v21 GA

    If a post solves your question please use the 'Verify Answer' button.

Children
No Data