
One of the most common problems users report is performance. These might be, the vague: "It just seems generally slow", or "when I do X it takes forever". Well from the command line and through the magic that is Live Response, you can now answer these questions without interrupting the user as long as you know when to take a capture.
Who knows this performance issue could be a crypto-miner at work or any other malicious process for that matter.
For this exercise, we will be using wpr.exe (Windows Performance Recorder), this is a command-line tool that really replaced xperf. The great news being, it's already on Windows 10/Windows 2016 computers. This saves having to fetch the ADK/SDK to install the Debugging Tools for Windows and install or copy parts of that file set to the end-user computer.
Stage 1 - The capture
Wpr.exe has a number of options, which can be seen by just running wpr.exe but for this example, we will be running:
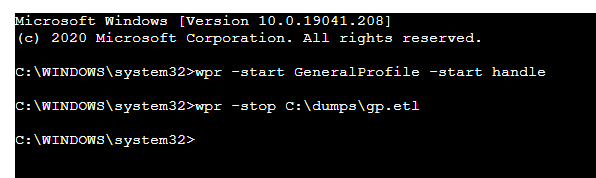
wpr.exe -start GeneralProfile -start Handle
This command will start the trace capture. You should then reproduce the problem as quickly as possible before stopping the capture with the command:
wpr.exe -stop C:\dumps\gp.etl
As shown in the following screen capture using Live Response:
The time between these commands is what you're capturing so, this should be the problem you want to capture. I would suggest, that ideally, you don't really want to capture more than 1 minute due to the size of the resultant file.
Tip: It might be worth checking the disk space before you begin, which you can do by running:
fsutil volume diskfree c:
Or as a plug for Live Discovery: https://community.sophos.com/products/intercept/early-access-program/f/live-discover-queries/120172/live-discover-query---show-the-free-disk-space
In the above command to start the trace I have specified the profiles: "GeneralProfile" and "Handle". You can see the other profiles available by running "wpr.exe -profiles", depending on the issue and data you require to analyze you may wish to use others in addition to or in isolation. Clearly the more profiles you enable, the larger the data captured, and the bigger the impact on the computer/end-user.
Stage 2 - The analysis
I will assume you have copied to your computer the gp.etl file and potentially the directory created next to the dump containing the symbols files (pdb) if this exists. If the directory exists will depend on if the target computer was setup for symbols. Most likely not, and for this general analysis it's not important but if you do see a directory named for example gp.etl.NGENPDB with a number of pdb files in it, it might be worth obtaining.
The tool of choice to analyze the etl file is Windows Performance Analyzer (WPA). This can be downloaded as part of the SDK or ADK and installed if you choose the component Windows Performance Toolkit. Another option, it to obtain WPA from the Microsoft Store which might be easier and often is the latest and greatest.
It would be almost impossible to cover how to analyze a performance trace in full here but, things you may want to consider to perform an initial triage of the dump include:
Processes - Lifetime by Process
This view could be used to get a high level of what processes are running on the computer, the default view is to group this by Lifetime, i.e. those processes that are Permanent or Transient to the trace window.
Note: The yellow line you see in the table view of the analysis window can be thought of as a "group by" function.
CPU Usage (Sampled) - Utilization by Process, Stack
This view, is helpful to quickly see, during the trace, which processes consumed the most CPU. The column "Weight (in view) (ms)" is worth sorting on. At this point, if you're looking into a CPU issue, you will be able to see the processes that are using the most CPU. You can then expand the stack column and follow down the paths which contribute the most. With symbols configured and loaded, for the modules you can obtain symbols for, you can hopefully make sense of what the process is doing. Bringing in the thread id column in front of the Stacks column you can evaluate the process/stacks from a thread perspective if needed.
If you find a module in the stack traces you are suspicious of, you can create a filter to show all stacks, for all processes where this module appears. To do so, click on the cog icon, before clicking Advanced and then specifying the module filter:
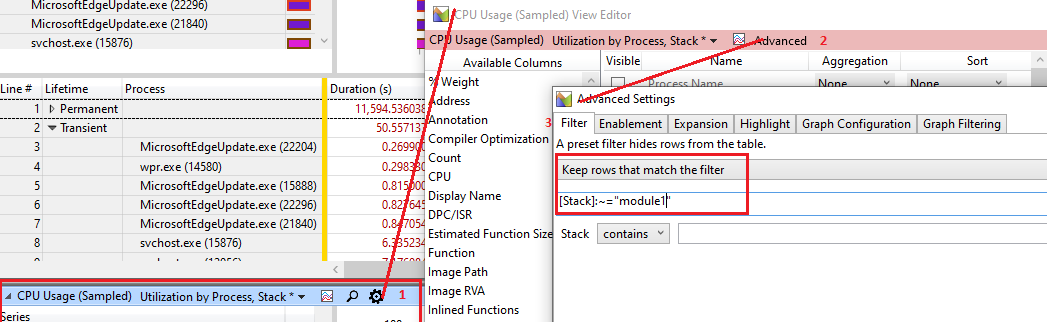
Note: This can take a while to filter.
I did include the "handles" filter in the trace, primarily to show how you can capture multiple profiles but handles are essential if you're troubleshooting a handle leak as a graph of handle counts over time makes a leak quite obvious. These can be grouped by handle type if needed. The "Create Stack" column will provide you info on the module and stack that created the handle also.
One other data set to consider might be:
Disk Usage - Utilization by Process, Path, Name, Stack
This will enable you to see the files, processes are operating on and provide more insight there.
The "System Configuration" view, under the "Trace" menu option also provides a wealth of system information you may also find useful in summary.
Hopefully, this post provides you with a few pointers on how you might go about solving a performance problem or learning more about process activity.
Regards,
Jak

