Disclaimer: This information is provided as-is for the benefit of the Community. Please contact Sophos Professional Services if you require assistance with your specific environment.
Purpose
Sophos Endpoint and Server products all come equipped with Application Control. This technology allows operators to monitor or restrict access to different programs and applications, such as System Tools or Browsers.
If you are not using this, our docs are here:
Often, an administrator may want to export a report of their current monitoring or block list. There may even come a time where the operator wants to see specific time stamps for frequency or use the information during a threat hunt.
Prerequisites
You must have XDR enabled in your environment.
This is intended for Windows only on Live Discovery.
Query Focus #1 - What are my Application Control Policies?
| System Impact | Large |
| Data Transferred | Small |
| Execution Time | Fast |
WITH policyStamp (stamp) AS
(SELECT data
FROM registry
WHERE key = 'HKEY_LOCAL_MACHINE\SOFTWARE\Sophos\Management\Policy\ApplicationControl\'
AND name = 'latest'),
policyFullStamp AS (
SELECT 'HKEY_LOCAL_MACHINE\SOFTWARE\Sophos\Management\Policy\ApplicationControl\' || stamp
FROM policyStamp),
appControl (name, status) AS (
SELECT name,
CASE
   WHEN data = 1 THEN 'Enabled'
   WHEN data = 0 THEN 'Disabled'
   ELSE data
END
FROM registry
WHERE key = (SELECT * FROM policyFullStamp))
SELECT * FROM appControl
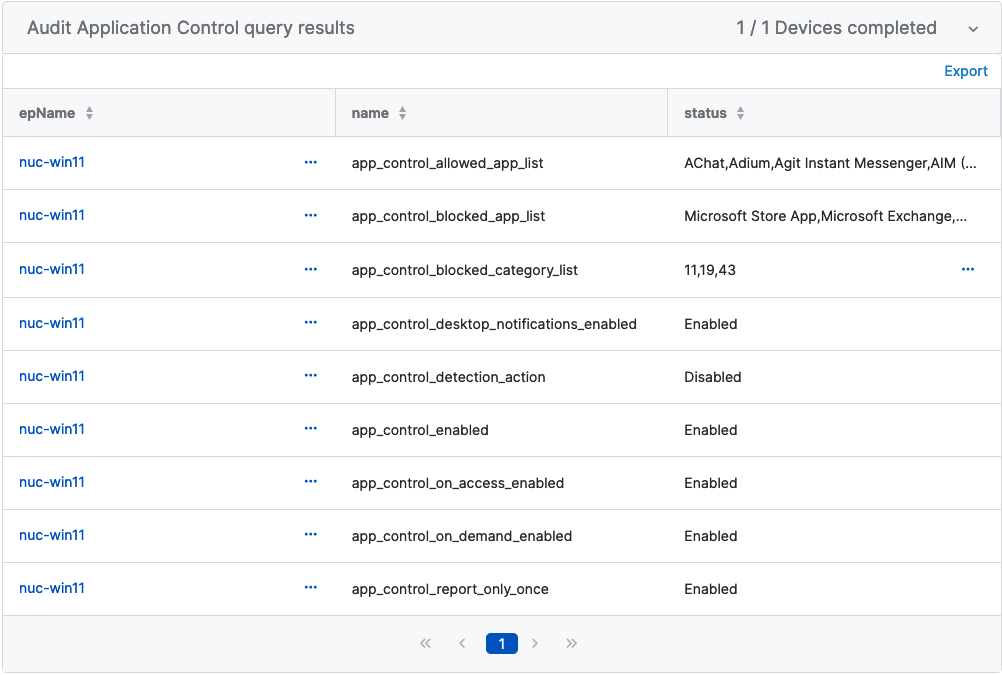
Results:

Important:
There are a few key areas you want to look at:
Policy Decision Making
app_control_detection_action = enabled = block
app_control_detection_action = disabled = allow (monitor/log)
Policy App List
app_control_blocked_app_list = list of apps that app_control_detection_action is looking for
Query Focus #2 - Can I see the Application Control Log Entries?
| System Impact | Largest |
| Data Transferred | Large |
| Execution Time | Slow |
-- Variable Type String
-- Variable Name YYYY-MM
-- Ex: 2022-10

WITH sspLog AS (
   SELECT *
   FROM grep
   WHERE path = 'C:\ProgramData\Sophos\Endpoint Defense\Logs\SSP.log'
   AND pattern = '$$YYYY-MM$$'),
logDetails (timestamp, description) AS (
   SELECT datetime(CAST(SPLIT(line, ' ', 0) AS VARCHAR),'localtime'),
         CAST(SPLIT(line, ']', 1) AS VARCHAR)
        FROM sspLog)
SELECT * FROM logDetails
WHERE description LIKE '%controlled app%'
ORDER BY timestamp DESC
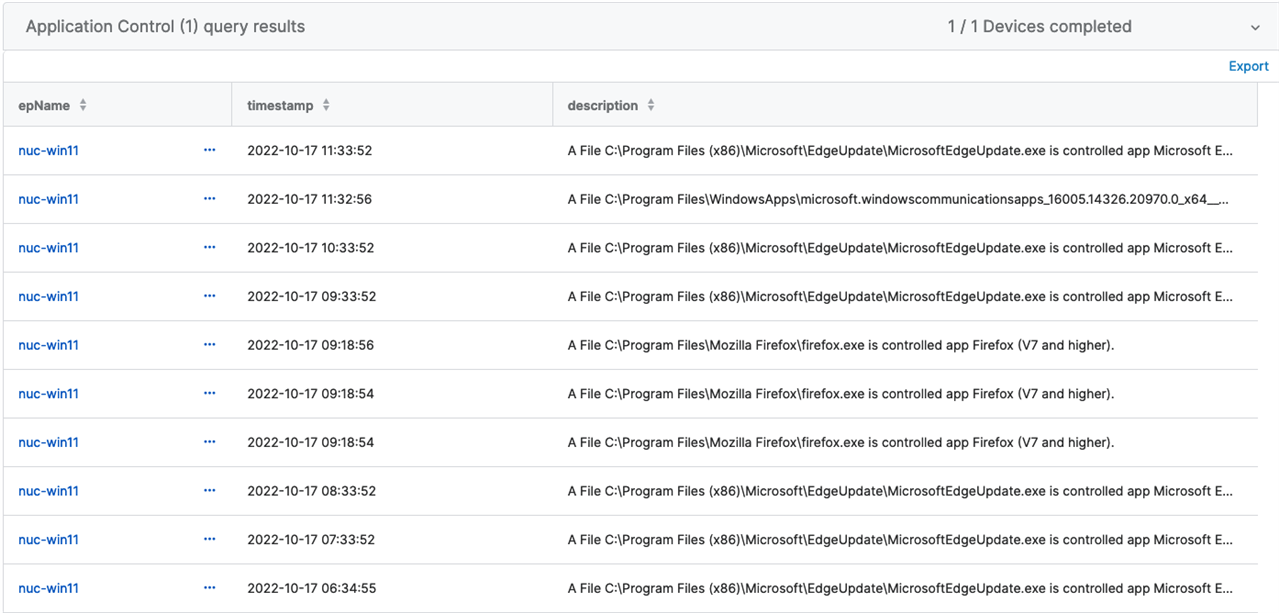
Results:

Understanding the Code
Focusing our attention to the variable in this query, we can pinpoint more specifics. For example, we used YYYY-MM to return an entire month of logs. This is why we see large costs in resources to compute this. If you modify the variable, to YYYY-MM-DD, this will allow us a more precise timeline and smaller query.
You will want to also reflect this change in line 9 of the shared code. If not, you can expect an error. In doing so, this will return a smaller cost in resources to the machines. You may want to query this further.
At the end of the query, you could add the program interaction you are hunting for.
Happy querying!
-jk
Added Disclaimer
[edited by: GlennSen at 3:55 PM (GMT -7) on 5 Apr 2023]
