Advisory: Support Portal Maintenance. Login is currently unavailable, more info available here.
Hi Guys,
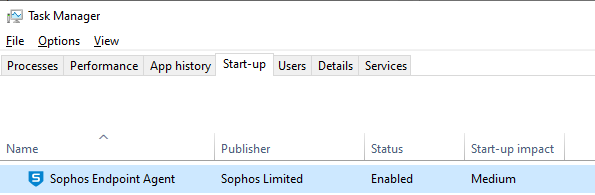
I run the Windows Insider Preview on a PC at home and after updating to Build 21277.1000 this morning the PC began constantly crashing logging into the PC (would load to login screen fine and stay there - crash was about 30 seconds after logging in) with a familiar Green Screen stop crash and bugcheck. A quick troubleshoot and I found that its definitely being caused by Sophos Intercept X Endpoint and I have disabled it in startup.Any ideas how to fix or do I need to wait until a new version of the Intercept X Client?Cheers
Do you have a memory dump, either in \windows\memory.dmp or \windows\minidump\ that corresponds to these?
If so, can you load it into WinDbg (can get it from the Store or by downloading the SDK) and attach the contents of the window?
Hi there, I just wanted to chime in because I'm also seeing the same error in my environment as Dread. Computers running the Windows 10 insider build 21277 will GSOD after login, unless 'Sophos Endpoint Agent' is disabled on startup. However, if the user launches Sophos Endpoint Agent afterwards, the computer will GSOD again.
I've attached the contents of WinDbg's analysis of both C:\Windows\MEMORY.DMP and the dump available in C:\Windows\Minidump .
from C:\Windows\MEMORY.DMP
Microsoft (R) Windows Debugger Version 10.0.20153.1000 AMD64 Copyright (c) Microsoft Corporation. All rights reserved. Loading Dump File [C:\Windows\MEMORY.DMP] Kernel Bitmap Dump File: Active memory is available Dump completed successfully, progress percentage: 100 ************* Path validation summary ************** Response Time (ms) Location Deferred srv* Symbol search path is: srv* Executable search path is: Windows 10 Kernel Version 21277 MP (8 procs) Free x64 Product: WinNt, suite: TerminalServer SingleUserTS Edition build lab: 21277.1000.amd64fre.rs_prerelease.201207-1443 Machine Name: Kernel base = 0xfffff807`6d200000 PsLoadedModuleList = 0xfffff807`6de33b30 Debug session time: Tue Jan 5 13:32:02.391 2021 (UTC - 8:00) System Uptime: 0 days 0:00:57.064 Loading Kernel Symbols ............................................................... ................................................................ ................................................................ ............................. Loading User Symbols ..................................... Loading unloaded module list ............ For analysis of this file, run !analyze -v nt!KeBugCheckEx: fffff807`6d619060 48894c2408 mov qword ptr [rsp+8],rcx ss:0018:fffff90d`ca3f7810=00000000000000ef 4: kd> !analyze -v ******************************************************************************* * * * Bugcheck Analysis * * * ******************************************************************************* CRITICAL_PROCESS_DIED (ef) A critical system process died Arguments: Arg1: ffffd30421ee8080, Process object or thread object Arg2: 0000000000000000, If this is 0, a process died. If this is 1, a thread died. Arg3: 0000000000000000 Arg4: 0000000000000000 Debugging Details: ------------------ KEY_VALUES_STRING: 1 Key : Analysis.CPU.mSec Value: 3437 Key : Analysis.DebugAnalysisProvider.CPP Value: Create: 8007007e on DESKTOP-UK4FQDV Key : Analysis.DebugData Value: CreateObject Key : Analysis.DebugModel Value: CreateObject Key : Analysis.Elapsed.mSec Value: 3445 Key : Analysis.Memory.CommitPeak.Mb Value: 93 Key : Analysis.System Value: CreateObject Key : Dump.Attributes.FilterDumpFile Value: 1 Key : WER.OS.Branch Value: rs_prerelease Key : WER.OS.Timestamp Value: 2020-12-07T14:43:00Z Key : WER.OS.Version Value: 10.0.21277.1000 ADDITIONAL_XML: 1 OS_BUILD_LAYERS: 1 DUMP_FILE_ATTRIBUTES: 0x1040 Filter Dump BUGCHECK_CODE: ef BUGCHECK_P1: ffffd30421ee8080 BUGCHECK_P2: 0 BUGCHECK_P3: 0 BUGCHECK_P4: 0 PROCESS_NAME: svchost.exe CRITICAL_PROCESS: svchost.exe ERROR_CODE: (NTSTATUS) 0x376f5080 - <Unable to get error code text> BLACKBOXBSD: 1 (!blackboxbsd) BLACKBOXNTFS: 1 (!blackboxntfs) BLACKBOXPNP: 1 (!blackboxpnp) BLACKBOXWINLOGON: 1 STACK_TEXT: fffff90d`ca3f7808 fffff807`6db6c90a : 00000000`000000ef ffffd304`21ee8080 00000000`00000000 00000000`00000000 : nt!KeBugCheckEx fffff90d`ca3f7810 fffff807`6da6e6d3 : ffffd304`21ee8080 ffffd304`28ac9378 00000000`00000000 fffff807`6d4fd3ef : nt!PspCatchCriticalBreak+0x11a fffff90d`ca3f78b0 fffff807`6d8f819c : ffffd304`21ee84b8 00000000`00000000 ffffd304`21ee8080 00007ffa`5908e001 : nt!PspTerminateAllThreads+0x174c8b fffff90d`ca3f7920 fffff807`6d8f7110 : ffffffff`ffffffff ffffd304`2a1d30c0 ffffd304`376f5080 00000000`80000001 : nt!PspTerminateProcess+0xe0 fffff90d`ca3f7960 fffff807`6d62b2f5 : ffffd304`000004b4 ffffd304`376f5080 ffffd304`21ee8080 ffffd304`00000000 : nt!NtTerminateProcess+0xb0 fffff90d`ca3f79e0 00007ffa`91a97174 : 00000000`00000000 00000000`00000000 00000000`00000000 00000000`00000000 : nt!KiSystemServiceCopyEnd+0x25 000000d2`06bff258 00000000`00000000 : 00000000`00000000 00000000`00000000 00000000`00000000 00000000`00000000 : ntdll!NtTerminateProcess+0x14 SYMBOL_NAME: ntdll!NtTerminateProcess+14 MODULE_NAME: ntdll IMAGE_NAME: ntdll.dll STACK_COMMAND: .thread ; .cxr ; kb BUCKET_ID_FUNC_OFFSET: 14 FAILURE_BUCKET_ID: 0xEF_svchost.exe_BUGCHECK_CRITICAL_PROCESS_376f5080_ntdll!NtTerminateProcess OS_VERSION: 10.0.21277.1000 BUILDLAB_STR: rs_prerelease OSPLATFORM_TYPE: x64 OSNAME: Windows 10 FAILURE_ID_HASH: {1f98d8f1-0ced-5a9a-8bb5-5da6943fc861} Followup: MachineOwner ---------
from the dump available in C:\Windows\Minidump
Microsoft (R) Windows Debugger Version 10.0.20153.1000 AMD64 Copyright (c) Microsoft Corporation. All rights reserved. Loading Dump File [C:\Windows\Minidump\010521-9546-01.dmp] Mini Kernel Dump File: Only registers and stack trace are available ************* Path validation summary ************** Response Time (ms) Location Deferred srv* Symbol search path is: srv* Executable search path is: Windows 10 Kernel Version 21277 MP (8 procs) Free x64 Product: WinNt, suite: TerminalServer SingleUserTS Edition build lab: 21277.1000.amd64fre.rs_prerelease.201207-1443 Machine Name: Kernel base = 0xfffff807`6d200000 PsLoadedModuleList = 0xfffff807`6de33b30 Debug session time: Tue Jan 5 13:32:02.391 2021 (UTC - 8:00) System Uptime: 0 days 0:00:57.064 Loading Kernel Symbols ............................................................... ................................................................ ................................................................ ............................. Loading User Symbols Loading unloaded module list ............ For analysis of this file, run !analyze -v nt!KeBugCheckEx: fffff807`6d619060 48894c2408 mov qword ptr [rsp+8],rcx ss:0018:fffff90d`ca3f7810=00000000000000ef 4: kd> !analyze -v ******************************************************************************* * * * Bugcheck Analysis * * * ******************************************************************************* CRITICAL_PROCESS_DIED (ef) A critical system process died Arguments: Arg1: ffffd30421ee8080, Process object or thread object Arg2: 0000000000000000, If this is 0, a process died. If this is 1, a thread died. Arg3: 0000000000000000 Arg4: 0000000000000000 Debugging Details: ------------------ KEY_VALUES_STRING: 1 Key : Analysis.CPU.mSec Value: 5093 Key : Analysis.DebugAnalysisProvider.CPP Value: Create: 8007007e on DESKTOP-UK4FQDV Key : Analysis.DebugData Value: CreateObject Key : Analysis.DebugModel Value: CreateObject Key : Analysis.Elapsed.mSec Value: 21744 Key : Analysis.Memory.CommitPeak.Mb Value: 82 Key : Analysis.System Value: CreateObject Key : WER.OS.Branch Value: rs_prerelease Key : WER.OS.Timestamp Value: 2020-12-07T14:43:00Z Key : WER.OS.Version Value: 10.0.21277.1000 ADDITIONAL_XML: 1 OS_BUILD_LAYERS: 1 BUGCHECK_CODE: ef BUGCHECK_P1: ffffd30421ee8080 BUGCHECK_P2: 0 BUGCHECK_P3: 0 BUGCHECK_P4: 0 PROCESS_NAME: svchost.exe CRITICAL_PROCESS: svchost.exe ERROR_CODE: (NTSTATUS) 0x376f5080 - <Unable to get error code text> BLACKBOXBSD: 1 (!blackboxbsd) BLACKBOXNTFS: 1 (!blackboxntfs) BLACKBOXPNP: 1 (!blackboxpnp) BLACKBOXWINLOGON: 1 CUSTOMER_CRASH_COUNT: 1 STACK_TEXT: fffff90d`ca3f7808 fffff807`6db6c90a : 00000000`000000ef ffffd304`21ee8080 00000000`00000000 00000000`00000000 : nt!KeBugCheckEx fffff90d`ca3f7810 fffff807`6da6e6d3 : ffffd304`21ee8080 ffffd304`28ac9378 00000000`00000000 fffff807`6d4fd3ef : nt!PspCatchCriticalBreak+0x11a fffff90d`ca3f78b0 fffff807`6d8f819c : ffffd304`21ee84b8 00000000`00000000 ffffd304`21ee8080 00007ffa`5908e001 : nt!PspTerminateAllThreads+0x174c8b fffff90d`ca3f7920 fffff807`6d8f7110 : ffffffff`ffffffff ffffd304`2a1d30c0 ffffd304`376f5080 00000000`80000001 : nt!PspTerminateProcess+0xe0 fffff90d`ca3f7960 fffff807`6d62b2f5 : ffffd304`000004b4 ffffd304`376f5080 ffffd304`21ee8080 ffffd304`00000000 : nt!NtTerminateProcess+0xb0 fffff90d`ca3f79e0 00007ffa`91a97174 : 00000000`00000000 00000000`00000000 00000000`00000000 00000000`00000000 : nt!KiSystemServiceCopyEnd+0x25 000000d2`06bff258 00000000`00000000 : 00000000`00000000 00000000`00000000 00000000`00000000 00000000`00000000 : 0x00007ffa`91a97174 SYMBOL_NAME: nt!PspCatchCriticalBreak+11a MODULE_NAME: nt IMAGE_NAME: ntkrnlmp.exe IMAGE_VERSION: 10.0.21277.1000 STACK_COMMAND: .thread ; .cxr ; kb BUCKET_ID_FUNC_OFFSET: 11a FAILURE_BUCKET_ID: 0xEF_svchost.exe_BUGCHECK_CRITICAL_PROCESS_376f5080_nt!PspCatchCriticalBreak OS_VERSION: 10.0.21277.1000 BUILDLAB_STR: rs_prerelease OSPLATFORM_TYPE: x64 OSNAME: Windows 10 FAILURE_ID_HASH: {a02b1c70-8dbe-b3af-aefe-af6b2a744809} Followup: MachineOwner ---------
When you say "unless 'Sophos Endpoint Agent' is disabled on startup", are you talking about just here:
All this does is run the Sophos UI.exe which is the tray icon and client UI. The key being:
HKEY_LOCAL_MACHINE\SOFTWARE\Microsoft\Windows\CurrentVersion\Run
Sophos UI.exe ="C:\Program Files\Sophos\Sophos UI\Sophos UI.exe" /hidden
It seems bizarre that a small user mode application can cause this.
From the info provided, without the dump file to be able to run other commands it's hard to say much. There is a thread in a svchost.exe process seemingly terminating a CRITICAL_PROCESS: svchost.exe. From the stack it's hard to glean the origin of the stack.
Currently installing Windows 10 insider build 21277 to see if I see the same.
Yes, that's what I disabled in the Startup pane in Task Manager. If I leave it enabled then shortly after login the computer will GSOD. Alternatively if you just launch Sophos Endpoint Agent from within the Sophos folder in the Start Menu, then that will also cause a GSOD.
Should I be running other commands against the dump file? I'm not very experienced with performing analysis on them but I can follow instructions if you have any suggestions.
Apologies for the delay getting back to this - I blame the Christmas/New Years period :)I had to disable ALL Sophos Services from Startup via the MSConfig.exe, Selective Startup and disabling all Sophos Services there for the system to boot safely.System still running fine up to today, just haven't had a chance to play with it ... I may have also been playing the crap out of Watch Dogs Legion ... :)
Could you leave it disabled in the startup items and disable Tamper Protection on the computer, reboot and then launch "sophos ui.exe". Does that help?
That works, thank you! Sophos can now be part of startup without incurring GSODs. However, is it feasible to leave Tamper Protection disabled long-term? What are the ramifications of doing so?
Well Tamper Protection stops people (or I guess malicious processes if they've got passed the execution stage) from stopping services and general fiddling.
I did reproduce it today and I found it quite odd.
CRITICAL_PROCESS_DIED (ef) - "A critical system process died" is the bugcheck code.The critical process that is dying is the svchost process that hosts the "RPCSS" service. I.e. 'C:\WINDOWS\system32\svchost.exe -k RPCSS -p'
A thread in this process is the the one calling kebugcheckex. This thread seems to be throwing an exception in RPCRT4!BCACHE::Free+0x96. The disassembly has:00007fff`e36c52b3 488d0daeda0a00 lea rcx,[RPCRT4!`string' (00007fff`e3772d68)]00007fff`e36c52ba 48ff154f9f0a00 call qword ptr [RPCRT4!_imp_DbgPrint (00007fff`e376f210)]
The string at 00007fff`e3772d68 contains: "RPC: BCache corruption detected at 0x%p."
Which might offer something and quite odd that a RPC call into RPCSS can crash it.
The thread is servicing a RPC call from the "C:\Program Files\Sophos\Sophos UI\savapi.exe" process, that is the "client" end of the RPC call into RPCSS.
The Sophos UI.exe process is activating the COM server that is SAVAPI.exe, which is why it appears to happen when Sophos UI.exe starts up. It's more about what savapi.exe is doing as a result as it "talks" to RPCSS.
If you disable Tamper Protection and rename savapi.exe to savapi.exe.off, re-enable Tamper Protection I think this would also work. I'm just surprised a user mode process, issuing a standard RPC COM call can crash RPCSS which in turn brings down the computer as it's a critical process.
The fact that disabling TP helps suggests that the Sophosed.sys driver might be involved as that is responsible for tamper protection and being a driver, they are the components that are usually cause such issues.
A user mode process on it's own can't cause a bugcheck.
I think you might have to create a ticket with Sophos.
I also experienced this issue on my Insider test systems as of 21277. Turning off Tamper Protection prior to restarting the systems allowed a normal restart. I was later able to turn Tamper Protection back on without a crash. I have reported this to Sophos, although they are of course not claiming to support 21277 at this time, which is reasonable.