This discussion has been locked.
You can no longer post new replies to this discussion. If you have a question you can start a new discussion

EDR SQLite journal disk activity

Hi everyone,

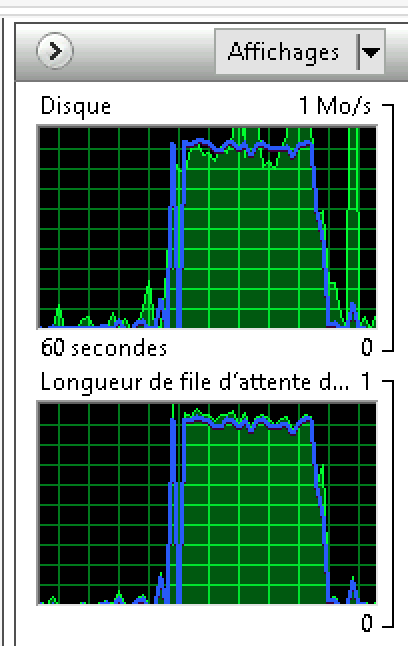
We have Sophos Intercept X with EDR installed on severals Windows Server 2016 and 2019. Every now and then, we can see this kind of disk activity :


The disk activity is almost maxed out and disk latency become bad (this is probably related to our architecture).

I get that it's simply sqlite method of doing a transaction, but is there anything we can do to improve this behavior ?

Products versions :


This thread was automatically locked due to age.
  • Unfortunately, the problem still persist. The peak disk activity last less time, but it is still present everytime the event journal is dumped. I guess it is just how the driver works ?

  • Is it more when the sspedr.exe process reading the journal files that have been dumped by the sophosed.sys driver  during the past 5 minutes or the disk IO on the sqlite db?

    You'd probably need to analyze a WPR log for the details to be sure.

    In an admin prompt you can run:

    wpr.exe -start GeneralProfile

    Then Capture the issue then run up to about 2 mins, then run:

    wpr.exe -stop C:\GeneralProfil.etl

    You can open the etl file in Windows Performance Analyzer (MS store of part of the Windows Performance Toolkit that comes with the SDK)

    If it is disk, you're most interested in, there are specific disk/IO profiles, namely, DiskIO and FileIO

    wpr.exe -start DiskIO
    or
    wpr.exe -start FileIO

    These will shed more light on IO specifics but GeneralProfile is typically enough insight.

    From your logs the DB file is only 50 MB, so it's not spending any time purging the db as it would it it was around the 500MB max size.

    The config options are under:
    HKEY_LOCAL_MACHINE\SOFTWARE\Sophos\EndpointDefense\PolicyConfiguration
    edr_max_tracking_database_size_mb (500MB)
    edr_upload_frequency is the 5 min interval.  It doesn't help to extend it, as the work will just have to be done on the next run.


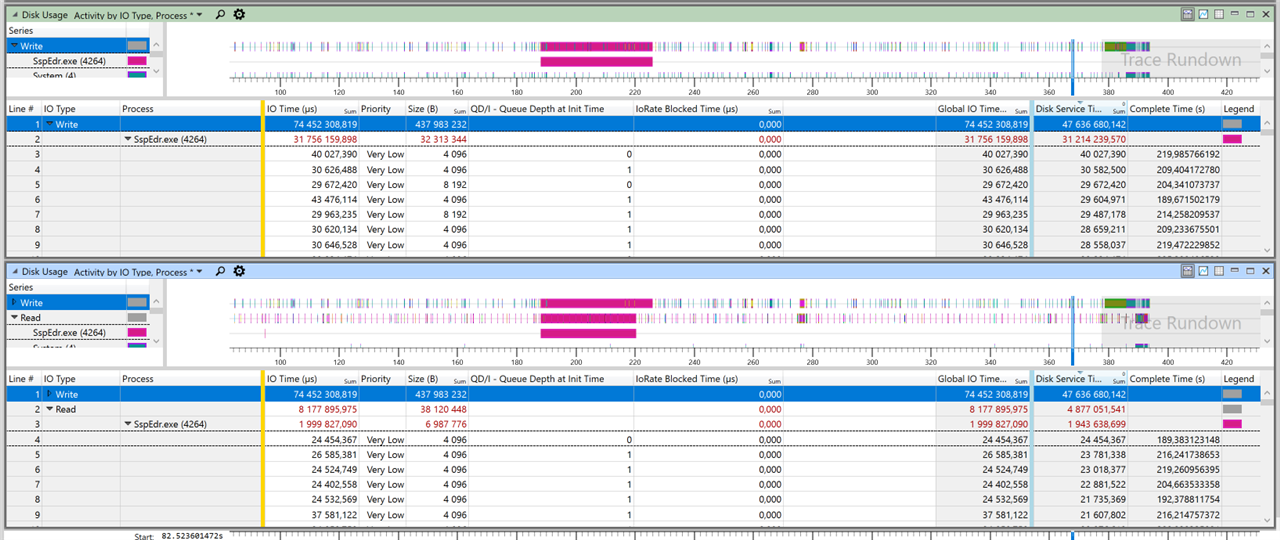
  • I'm sorry it's my first time using Windows Performance Analyzer, don't know if this is useful :

    Looks like SspEdr.exe is doing a lot of 4096 or 8192 read/write

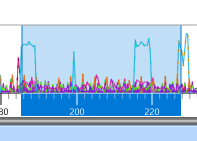
    CPU during the problem has no specific peak (the ones you see are WmiSEPrv.exe)

  • The priority for the disk IO is "Very Low" for sspedr.exe, this explains why it may take a while on each run, especially if other processes with a higher priority comes long. This I assume is intentional such that the process sspedr.exe doesn't cause issues with other processes and just yields if anything else needs resource.

    The "Utilization by Process, Path, Name, Stack" filter might be preferable and selectable from the drop down (next to "Disk Usage" title), will give you the file paths of interest grouped by the process name by default.  I assume for sspedr.exe it's the "C:\ProgramData\Sophos\Endpoint Defense\Data\Edr Saved Data\EdrTrickleFeed.sqlite" and "C:\ProgramData\Sophos\Endpoint Defense\Data\Edr Saved Data\EdrTrickleFeed.sqlite-journal" files that are of most interest?

    If this is a SSD, this should be quick enough.

  • Indeed it is :

    Our VM datastores uses storage from a Network RAID-10 array, I think it's the lot of small operation that makes the latency spike.

    Underlying disks are SSD though.