Users may observe intermittent issues with our ticketing system, which may cause delays in processing case updates. While our teams actively work on a fix, please contact our Technical Support Hotline for any critical issues.
Users may observe intermittent issues with our ticketing system, which may cause delays in processing case updates. While our teams actively work on a fix, please contact our Technical Support Hotline for any critical issues.
Disclaimer: This information is provided as-is for the benefit of the Community. Please contact Sophos Professional Services if you require assistance with your specific environment.
______________________________________________________________________________________________________________________________________
Table of Contents
Overview
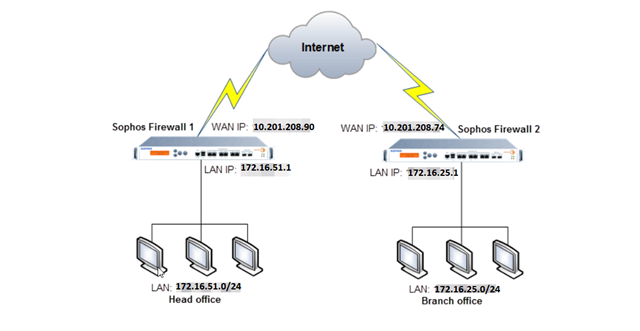
Setup Diagram
Related information
This article describes the steps on how to identify the issue related to communication not happening or traffic not flowing through up and running IPSec tunnel or previously working IPsec tunnel when no changes are done in the configuration at either end.
Applies to the following Sophos products and versions
Sophos Firewall
Consider the setup scenario where you have configured an IPsec tunnel between Sophos Firewall to Sophos Firewall or Sophos Firewall to any other VPN gateway which is up and running. Required rules with the proper condition already there on both the end firewall and communication is working fine.
Suddenly you started observing an issue related to communication not happening or traffic not flowing through the IPSec tunnel. However, tunnel status and SA status on Sophos Firewall UI are showing up and no configuration changes are done with any settings or policy on either end VPN gateway firewall.
Such issue may occur if the ESP packets generated from one end firewall may dropped or blocked or not reached to the remote end firewall or VPN gateway device.
This could be possible due to any other firewall in the network path dropping or blocking ESP proto 50 packets or there are routing issues in the ISP cloud for proto 50 which may impact IPSec VPN traffic flow.
To identify such issue further you may capture the ESPDUMP or ESP packet (protocol 50) on Sophos Firewall shell or CLI via the command mentioned below :
Command from the shell:
#tcpdump -ni any proto 50
Command from console CLI:
console> tcpdump 'proto 50
If you are running multiple tunnels and you would like to capture the traffic for the interested tunnel over which you are facing a communication issue, in such case you may collect the tcpdump on Sophos Firewall over that IP directly via the below command as well.
Command from the shell:
# tcpdump -ni any host X.X.X.X
Command from console:
console> tcpdump 'host X.X.X.X
Where X.X.X.X is the remote end VPN gateway IP.
You may use the same command if the remote VPN peer is Sophos Firewall else for any other VPN gateway devices you may use the respective command based on that device platform.
If you are not able to get the two-way packets (or the packets are in a unidirectional only) then the issue could be related to ESP packet loss over the network path between both the VPN gateway devices as mentioned above.
In such a scenario, you may contact both the end ISP to confirm there is no blockage or dropping for ESP protocol 50 packets by any devices across the routing path.
Generally, such issue is random in nature and may be getting observed intermittently. Additionally, it may get fixed automatically without any action by the administrator on either end VPN gateway firewall once the outage over the ISP cloud (ISP path) is fixed.
Consider the below scenario to understand working condition logs and packets:
HO Sophos Firewall: LAN Network: 172.16.51.0/24
WAN ISP IP: 10.201.208.90
BO Sophos Firewall: LAN Network: 172.16.25.0/24
WAN ISP IP: 10.201.208.74
The IPsec tunnel is up and running and communication to remote LAN is also fine, In such working conditions, you may get logs like below on Sophos Firewall.
PING generated from HO location machine which has an IP address assigned 172.16.51.166 to BO location machine which has IP address assigned 172.16.25.57.
System 172.16.51.166 CMD output:
C:\Users\Admin>ping 172.16.25.57
Pinging 172.16.25.57 with 32 bytes of data:
Reply from 172.16.25.57: bytes=32 time=2ms TTL=126
Reply from 172.16.25.57: bytes=32 time=2ms TTL=126
Reply from 172.16.25.57: bytes=32 time=2ms TTL=126
Reply from 172.16.25.57: bytes=32 time=2ms TTL=126
Ping statistics for 172.16.25.57:
Packets: Sent = 4, Received = 4, Lost = 0 (0% loss),
Approximate round trip times in milli-seconds:
Minimum = 2ms, Maximum = 2ms, Average = 2ms
During the above successful PING, I have collected HO and BO ESPDUMP and TCPDUMP at the same time for working output reference which you may compare with the non-working output when data communication not working though the tunnel is up and running.
HO Sophos Firewall ESPDUMP on proto 50:
console> tcpdump 'proto 50
tcpdump: Starting Packet Dump
12:40:33.719009 Port2, OUT: IP 10.201.208.90 > 10.201.208.74: ESP(spi=0xce7e0b05,seq=0x14), length 104
12:40:33.720733 Port2, IN: IP 10.201.208.74 > 10.201.208.90: ESP(spi=0xc15b8ebc,seq=0x14), length 104
12:40:34.741282 Port2, OUT: IP 10.201.208.90 > 10.201.208.74: ESP(spi=0xce7e0b05,seq=0x15), length 104
12:40:34.742419 Port2, IN: IP 10.201.208.74 > 10.201.208.90: ESP(spi=0xc15b8ebc,seq=0x15), length 104
12:40:35.756549 Port2, OUT: IP 10.201.208.90 > 10.201.208.74: ESP(spi=0xce7e0b05,seq=0x16), length 104
12:40:35.757372 Port2, IN: IP 10.201.208.74 > 10.201.208.90: ESP(spi=0xc15b8ebc,seq=0x16), length 104
12:40:36.787703 Port2, OUT: IP 10.201.208.90 > 10.201.208.74: ESP(spi=0xce7e0b05,seq=0x17), length 104
12:40:36.788890 Port2, IN: IP 10.201.208.74 > 10.201.208.90: ESP(spi=0xc15b8ebc,seq=0x17), length 104
^C
8 packets captured
8 packets received by filter
0 packets dropped by kernel
Here from this output, we may confirm that for each ICMP request-reply packet, there is one in-out ESPDUMP packet. So a total of 8 packets were captured and received.
HO Sophos Firewall TCPDUMP on remote end machine IP:
console> tcpdump 'host 172.16.25.57
tcpdump: Starting Packet Dump
12:40:33.718504 Port1, IN: IP 172.16.51.166 > 172.16.25.57: ICMP echo request, id 1, seq 24, length 40
12:40:33.720767 ipsec0, IN: IP 172.16.25.57 > 172.16.51.166: ICMP echo reply, id 1, seq 24, length 40
12:40:33.720939 Port1, OUT: IP 172.16.25.57 > 172.16.51.166: ICMP echo reply, id 1, seq 24, length 40
12:40:34.740708 Port1, IN: IP 172.16.51.166 > 172.16.25.57: ICMP echo request, id 1, seq 25, length 40
12:40:34.742471 ipsec0, IN: IP 172.16.25.57 > 172.16.51.166: ICMP echo reply, id 1, seq 25, length 40
12:40:34.742591 Port1, OUT: IP 172.16.25.57 > 172.16.51.166: ICMP echo reply, id 1, seq 25, length 40
12:40:35.756268 Port1, IN: IP 172.16.51.166 > 172.16.25.57: ICMP echo request, id 1, seq 26, length 40
12:40:35.757414 ipsec0, IN: IP 172.16.25.57 > 172.16.51.166: ICMP echo reply, id 1, seq 26, length 40
12:40:35.757563 Port1, OUT: IP 172.16.25.57 > 172.16.51.166: ICMP echo reply, id 1, seq 26, length 40
12:40:36.787505 Port1, IN: IP 172.16.51.166 > 172.16.25.57: ICMP echo request, id 1, seq 27, length 40
12:40:36.788943 ipsec0, IN: IP 172.16.25.57 > 172.16.51.166: ICMP echo reply, id 1, seq 27, length 40
12:40:36.789136 Port1, OUT: IP 172.16.25.57 > 172.16.51.166: ICMP echo reply, id 1, seq 27, length 40
^C
12 packets captured
12 packets received by filter
0 packets dropped by kernel
Here from this output for 4 successful PING packets, it has captured total 12 packets counts (excluding 4 IPsec out packet) as IPsec out over CLI will not be seen in TCPDUMP.
BO Sophos Firewall ESPDUMP on proto 50:
console> tcpdump 'proto 50
tcpdump: Starting Packet Dump
12:42:04.735476 Port2, IN: IP 10.201.208.90 > 10.201.208.74: ESP(spi=0xce7e0b05,seq=0x14), length 104
12:42:04.736875 Port2, OUT: IP 10.201.208.74 > 10.201.208.90: ESP(spi=0xc15b8ebc,seq=0x14), length 104
12:42:05.757817 Port2, IN: IP 10.201.208.90 > 10.201.208.74: ESP(spi=0xce7e0b05,seq=0x15), length 104
12:42:05.758573 Port2, OUT: IP 10.201.208.74 > 10.201.208.90: ESP(spi=0xc15b8ebc,seq=0x15), length 104
12:42:06.773061 Port2, IN: IP 10.201.208.90 > 10.201.208.74: ESP(spi=0xce7e0b05,seq=0x16), length 104
12:42:06.773611 Port2, OUT: IP 10.201.208.74 > 10.201.208.90: ESP(spi=0xc15b8ebc,seq=0x16), length 104
12:42:07.804306 Port2, IN: IP 10.201.208.90 > 10.201.208.74: ESP(spi=0xce7e0b05,seq=0x17), length 104
12:42:07.805080 Port2, OUT: IP 10.201.208.74 > 10.201.208.90: ESP(spi=0xc15b8ebc,seq=0x17), length 104
^C
8 packets captured
8 packets received by filter
0 packets dropped by kernel
BO Sophos Firewall TCPDUMP on remote end machine IP:
console> tcpdump 'host 172.16.51.166
tcpdump: Starting Packet Dump
12:42:04.735569 ipsec0, IN: IP 172.16.51.166 > 172.16.25.57: ICMP echo request, id 1, seq 24, length 40
12:42:04.736149 Port1, OUT: IP 172.16.51.166 > 172.16.25.57: ICMP echo request, id 1, seq 24, length 40
12:42:04.736725 Port1, IN: IP 172.16.25.57 > 172.16.51.166: ICMP echo reply, id 1, seq 24, length 40
12:42:05.757860 ipsec0, IN: IP 172.16.51.166 > 172.16.25.57: ICMP echo request, id 1, seq 25, length 40
12:42:05.758048 Port1, OUT: IP 172.16.51.166 > 172.16.25.57: ICMP echo request, id 1, seq 25, length 40
12:42:05.758477 Port1, IN: IP 172.16.25.57 > 172.16.51.166: ICMP echo reply, id 1, seq 25, length 40
12:42:06.773091 ipsec0, IN: IP 172.16.51.166 > 172.16.25.57: ICMP echo request, id 1, seq 26, length 40
12:42:06.773190 Port1, OUT: IP 172.16.51.166 > 172.16.25.57: ICMP echo request, id 1, seq 26, length 40
12:42:06.773544 Port1, IN: IP 172.16.25.57 > 172.16.51.166: ICMP echo reply, id 1, seq 26, length 40
12:42:07.804342 ipsec0, IN: IP 172.16.51.166 > 172.16.25.57: ICMP echo request, id 1, seq 27, length 40
12:42:07.804420 Port1, OUT: IP 172.16.51.166 > 172.16.25.57: ICMP echo request, id 1, seq 27, length 40
12:42:07.805004 Port1, IN: IP 172.16.25.57 > 172.16.51.166: ICMP echo reply, id 1, seq 27, length 40
^C
12 packets captured
12 packets received by filter
0 packets dropped by kernel
During a non-working scenario where tunnel and SA is up and data communication not working you may collect the ESP dump and verify the packets (via TCPDUMP) as per the above steps to conclude the issue further.
______________________________________________________________________________________________________________________________________


 Quote
Quote