
For folks that have joined the MTR Connector EAP and enabled the MS Graph Security connector I wanted to provide a simple set of instructions for how you can view all your detections.
More detailed queries are available in the query section, but for a quick look at what the MTR team is now able to see I have the instructions below.
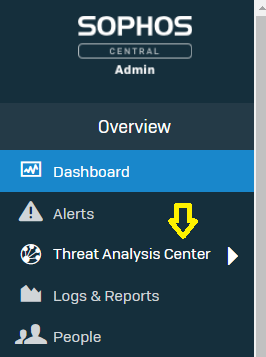
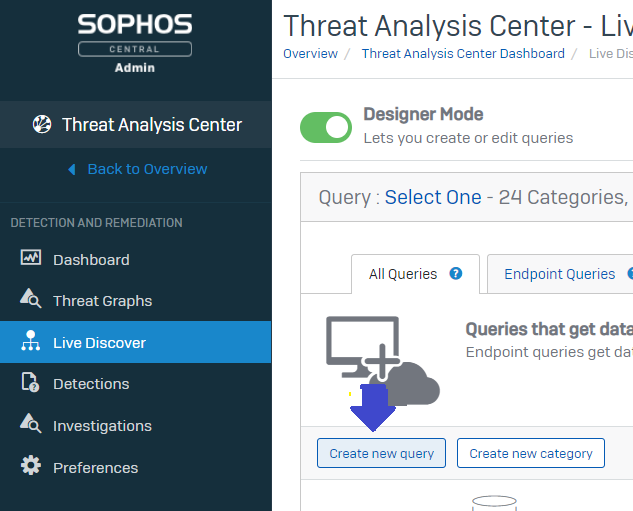
Simply log into central and navigate to the Threat Analysis Center
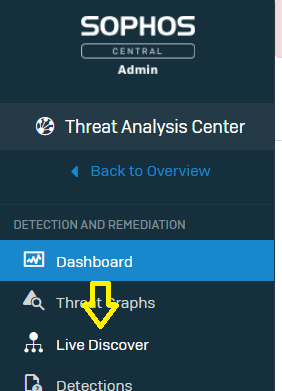
Then to Live Discover
Turn on Designer Mode
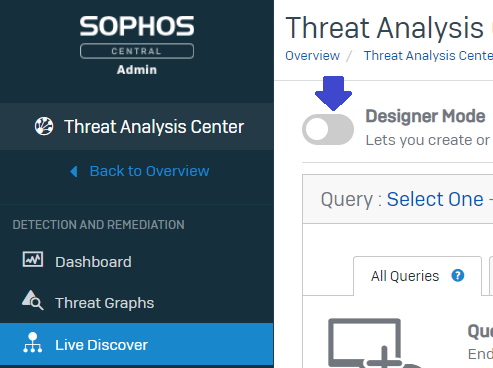
Select Create new query
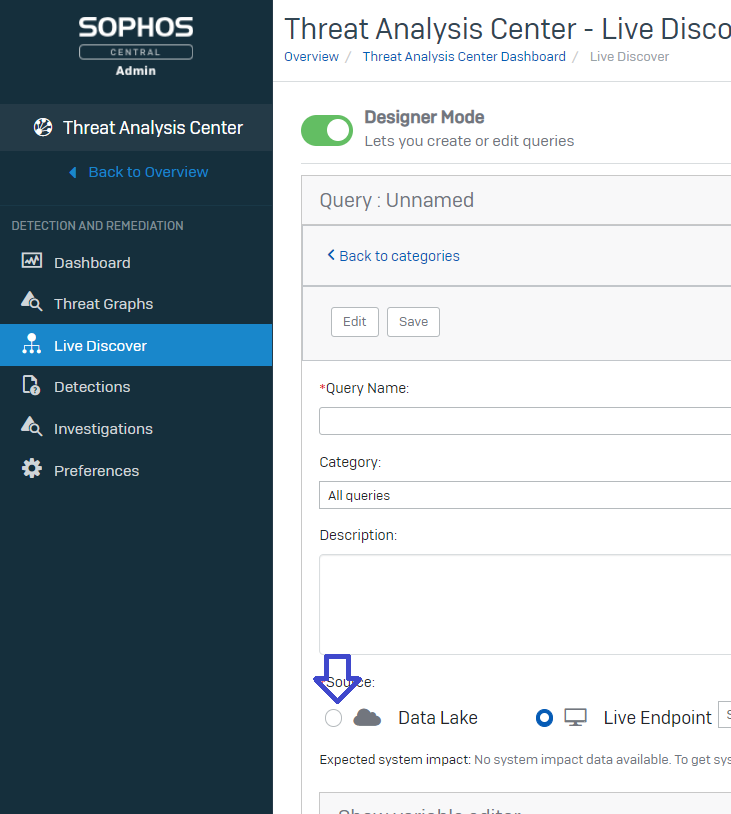
This will be a data lake query so select that modal
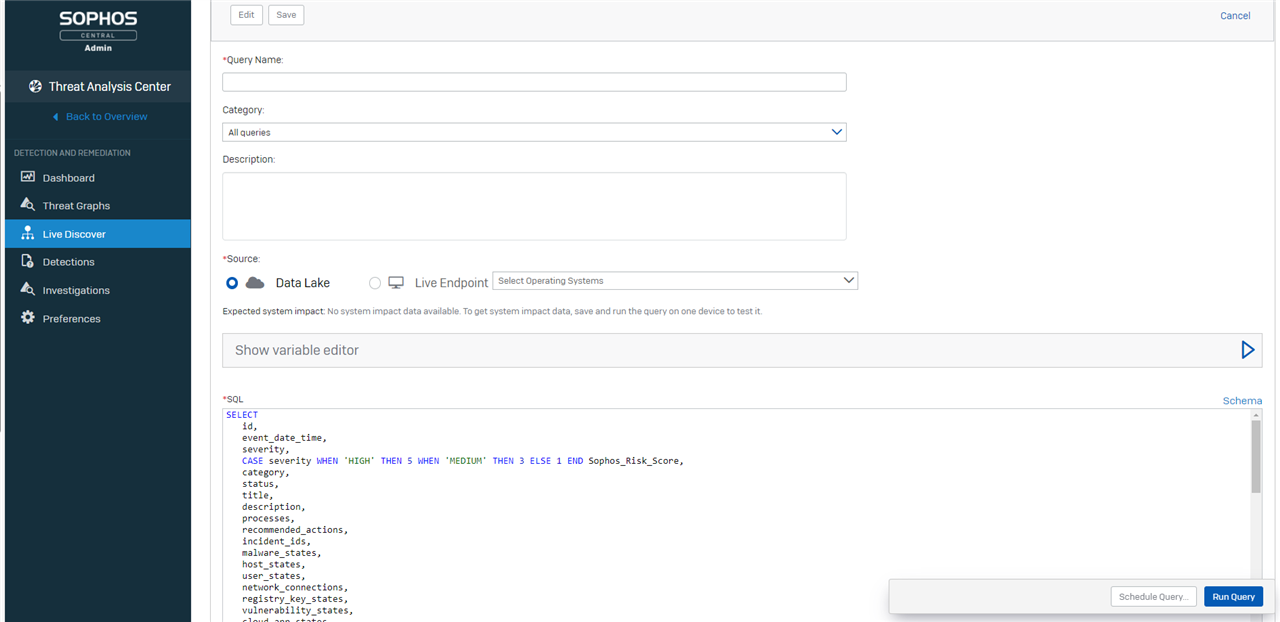
Now paste in the following SQL Code
And then select RUN
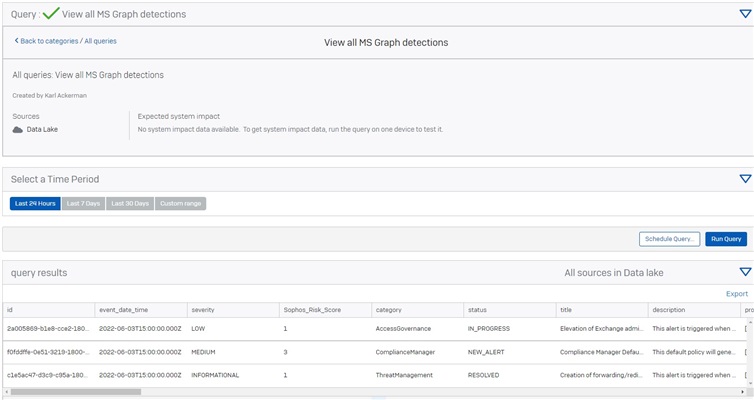
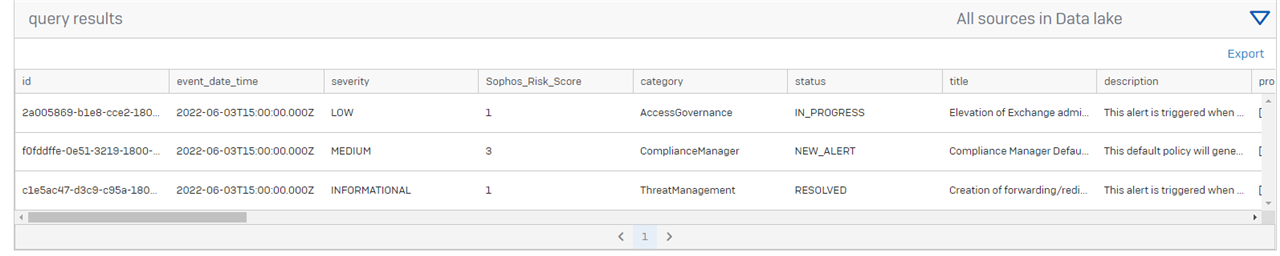
The results of the query should take a few seconds and you will see a list of all detections
This summer we will be updating central to automatically show the detection in the the main detections dashboard. For now know that these detections are reaching the MTR Security team and we are evaluating if an investigation is warranted given the alert information.
Thanks
Karl
