This discussion has been locked.
You can no longer post new replies to this discussion. If you have a question you can start a new discussion

Are there any time based reports in iView that present as line charts?

As I have been using iView, I see what seems to be a glaring omission, or am I missing something. There are no line charts, just bar charts and pie charts. Without line charts, you can't present data in a graph that shows usage over time.

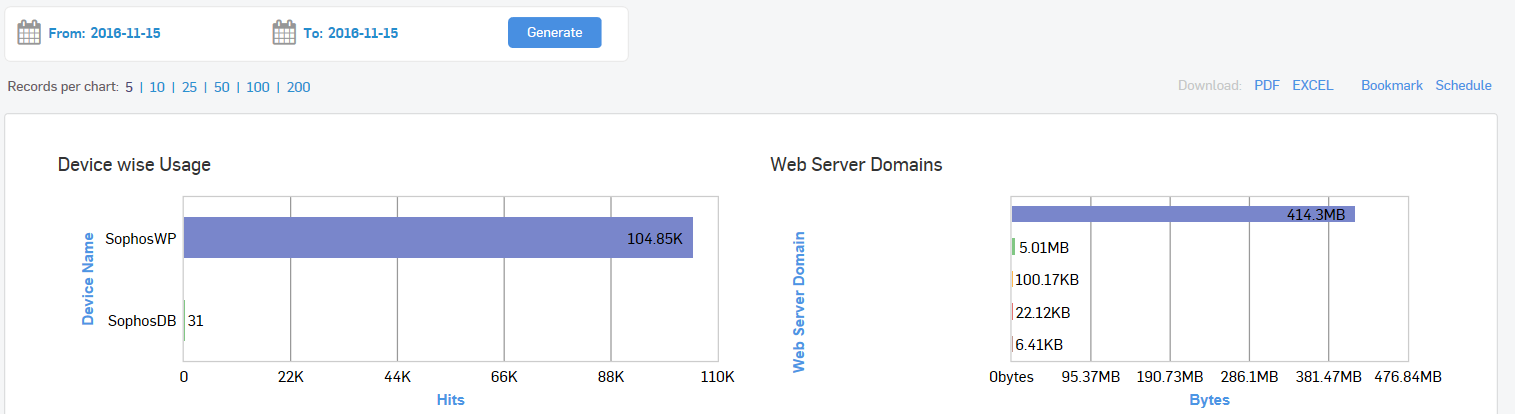
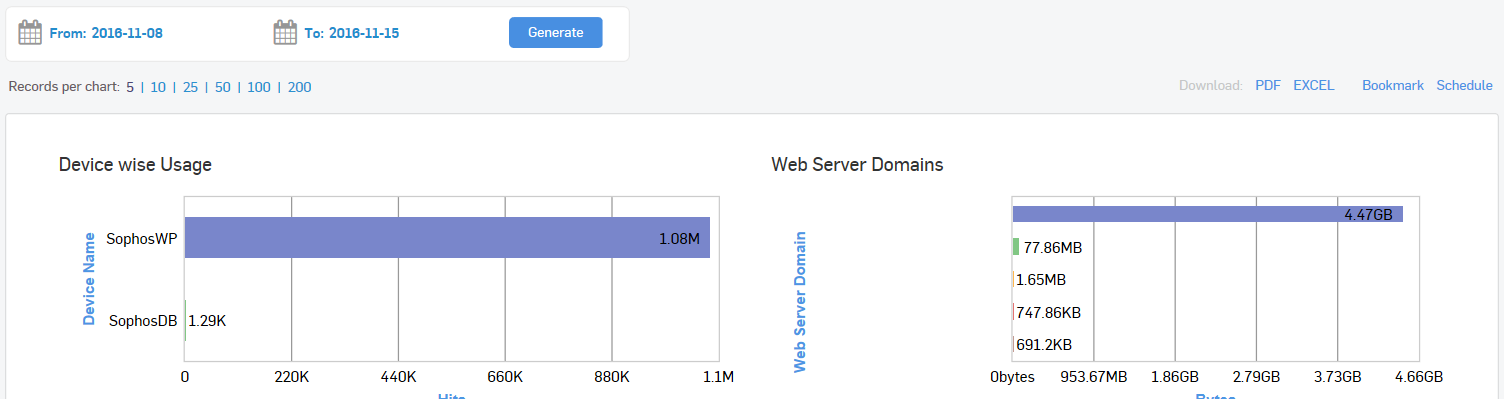
Take the Web Server Protection data. It's a bar chart. We have several websites, one that is heavily used. You can only see one bar. The others are so small that they don't even show up. Also, no matter how large the time range, you still only have one bar, just the numbers get larger. I can't see how much traffic each site generated each day of the week.

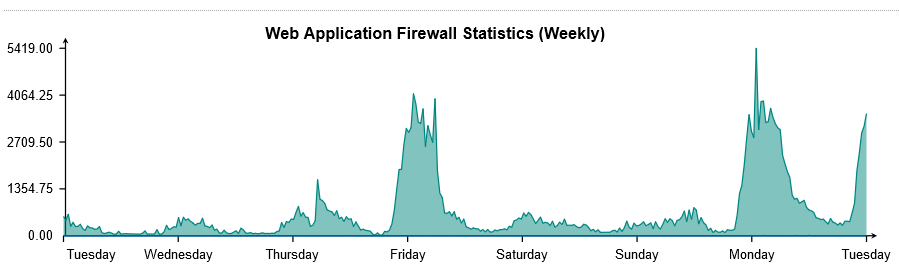
Even the UTM reports have line charts on the Web Protection reports. Unfortunately you can't drill down to individual domains/services.


This thread was automatically locked due to age.
Parents Reply Children
  • I am not sure that we are talking about the same thing. Here is the chart I am referring to:

    This is one days worth of traffic. Here is one week:

    Graphically, there is no real distinction between a weeks worth of data or a days. Except that one site just has a lot more traffic. The sites that don't have so much traffic barely register.

    This is from the UTM:

    This shows me traffic over time, which is much more useful than either a bar chart or a pie chart visually. The problem is that the UTM data doesn't break out the traffic by domain like iView does, it just has total traffic. As I add more sites, iView will show me how much traffic each site gets, but not WHEN it gets that traffic.

  • Hi Tim,

    What I understand through your reply is you want more granularized form of reporting data. Is that what you meant?

    If you are looking for detailed and custom reports, go to Custom and Specials > Custom Web Reports > Details. PFA screenshot:

    Thanks

    Sachin Gurung
    Team Lead | Sophos Technical Support
    Knowledge Base  |  @SophosSupport  |  Video tutorials
    Remember to like a post.  If a post (on a question thread) solves your question use the 'This helped me' link.

  • Not exactly. I want to see how many requests and how much data was being served by different WAF services throughout the day. Right now this data is only shown cumulatively for the report period, which can only be as small as 1 day. And if you make it longer than one day it is still the total and not the totals for each day.


    I would like to see a daily report that shows traffic by hour and by site:

      09:00 10:00 11:00  12:00 13:00 14:00
     Site A  10,000 9,500 11,000 12,000 11,500 10,00
     Site B  1,000 500 400 200 500 600
     Site C  50 100 75 125 150 200
     Site D  8,000 8,500 8,600 7,500 7,300 7,100

    And a graph based on that data that looks more like this:

    Then if I select a multi-day range it would show the total request per site per day.

    It's not about the quantity of traffic as much as it is about the flow of traffic over time.

  • Tim,


    Did you have any luck with this? I am in search of the same type of report. Even if it is just the data from each connection/stream over time. With the old cyberoam interface I could at least get the data (very clunky) as below however I can't seem to find it since we have moved to sophos XG

    • Internet Usage > Data wise Usage Report Drill into day and/or user of interest
      • Change view to Show 200 records per page and Detail view
      • Export each page to excel and copy raw data into a spreadsheet
  • No, I gave up on iView. It just didn't meet my needs and it didn't seem like they would be enhancing it in any meaningful way in the near future. For user reporting, I use FastVue Sophos Reporter. It helps somewhat, but is geared towards internal user reporting and not towards system level or web server reporting.

  • Thanks Tim will get a trial and see how it goes.