This discussion has been locked.
You can no longer post new replies to this discussion. If you have a question you can start a new discussion

UTM Version 9.352-6 and 9.318-5 released (Do not install!!)

DO NOT INSTALL - THE UPDATES ARE FAULTY (Read this thread through!)

News

· Security Update
Remarks

· System will be rebooted
Bugfixes

36115 WebAdmin reflective XSS Vulnerability
36126 OpenSSL security update 1.0.1q


This thread was automatically locked due to age.
  • Hi, All.
    After update (9.352-6) I have caught the problem with Flow Monitor and Multipath rules.
    Aleks
  • Hi Aleks,

    what is the issue with the Multipath Rules?

    Cheers,
    Sascha

    Cheers,

    Sascha Rudolph
    Senior Software Engineer, NSG

  • The fix from support:

    Ask for MANTIS 36171 and they will install this RPM : ep-webadmin-9.35-179.g76399f7.i686.rpm and restart the HTTPD, after that, all is good with Flow Monitor.

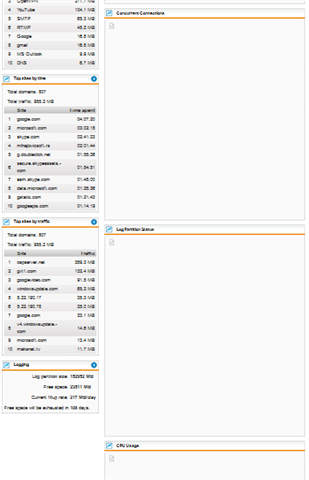
    BUT Concurrent connections image on the Dashboard is still missing. (As Sascha wrote, i am not entirely sure this has anything to do with 9.352-6...but you'll never know...)

    -----

    Best regards
    Martin

    Sophos XGS 2100 @ Home | Sophos v20 Architect

  • The Concurrent connections image is the same which is used in the Daily Executive Report. Since the latter is broken for unknown reasons after the up2date (not on fresh installs) you are not seeing it on the dashboard either.

    Cheers,

    Sascha Rudolph
    Senior Software Engineer, NSG

  • It is not only Concurent Connection image. Log Partition Status, CPU Usage, Memory/Swap Usage and Partition Usage are also not displaying. I always put all of them on the main Dashboard.

  • Okay, let me be more precise about that: any of the charts you can enable in the Dashboard are generated by RRDTool and are shared among the Executive Report and WebAdmin Dashboard. So both issues, seem to have the very same root cause - which is unrelated to the patches done in the WebAdmin.

    Cheers,

    Sascha Rudolph
    Senior Software Engineer, NSG

  • so the issues are related to the faulty udpate.. without update no issue, after update you get the errors.

    greets

    zaphod
    ___________________________________________

    Home: Zotac CI321 (8GB RAM / 120GB SSD)  with latest Sophos UTM
    Work: 2 SG430 Cluster / many other models like SG105/SG115/SG135/SG135w/...

  • It must be somehow related, because the problem started after the update.
  • I didn't say at all that it's not caused during the update but it's most likely not because of the released bugfixes.

    Cheers,

    Sascha Rudolph
    Senior Software Engineer, NSG

  • Another issue here: We have 2 UTM9 on custom-build hardware (Well, used two old homebuilt 19" Servers with lots of nics and a SSD as Firewall) that re-ordered the ethX-numbering after install of 9.352-6.

    Hardware layout: 2x onboard Realtek GigE with ASUS MAC, 2x PCIe Intel 350T2 ports, 4 ports on further dual-port realtek NICs with MAC prefix from NIC manufacturer.
    Management and Heartbeat previously on onboard NICs.

    After install/reboot of the HA system connections were lost, no heartbeat- first investigation brought up that the scanning order of the NICs was different than from before the update, so some interfaces were connected in the wrong way.
    My colleague, that performed the update, spent some time that evening isolating one half of the HA pair, and reassigning interfaces so that normal operation for the users could continue, and I am in the progress of having further downtime announced this weekend so that I can undergo extended analysis of what happened and probably downgrade the HA pair to an older revision. (Yes, will probably have to setup old image and up2date to previous version...)

    Question: Where can I have a look which components have changed in the 9.352-6 patch? I assumed that only some issues in the webinterface have been fixed, so I did not expect this drastic behaviour- which will cost me part of the weekend to fix...