Dear All,
my system has 4 GB of RAM and with EAP2, memory utilisation is 84%.
Sophos: is this the normal or what you expect for such a system?
Thanks
Dear All,
my system has 4 GB of RAM and with EAP2, memory utilisation is 84%.
Sophos: is this the normal or what you expect for such a system?
Thanks
FYI
My 310 rev2 has 12gb. In eap2 it dropped to 42% from 80%.
My memory usage has gone down slightly in the vm from mid 80s to mid 70s but that could be due to a reboot. My load average has improved tremendously. I don't know what they did but the firewall is just sitting there idling. I am impressed.
On memory, I think with 4GB minimum requirement, you will see XG use almost ALL the memory on a 4GB system. I don't know if that is sustainable or not with a lot of firewall rules and DPI enabled. Lets hope that we don't have problems with OOM killer.
Regards
Bill
Just upgraded from v17 to v18 EAP2 today. With v17, I was sitting around 60-65% memory utilization. With EAP2, I'm around 90%. This is with 4GB of RAM. I have IPS policies with ~1,500 to 6,000 signatures, application filtering with ~300 to 600 signatures and web policies for ~6 categories.
Here are the results from `system diagnostics show memory` from the console.
MemTotal: 3950056 kB
MemFree: 179432 kB
MemAvailable: 129952 kB
Buffers: 22628 kB
Cached: 189904 kB
SwapCached: 26720 kB
Active: 2795172 kB
Inactive: 620152 kB
Active(anon): 2751160 kB
Inactive(anon): 564108 kB
Active(file): 44012 kB
Inactive(file): 56044 kB
Unevictable: 0 kB
Mlocked: 0 kB
SwapTotal: 1563328 kB
SwapFree: 1351872 kB
Dirty: 508 kB
Writeback: 0 kB
AnonPages: 3178468 kB
Mapped: 138356 kB
Shmem: 112468 kB
Slab: 68136 kB
SReclaimable: 24672 kB
SUnreclaim: 43464 kB
KernelStack: 13280 kB
PageTables: 37044 kB
NFS_Unstable: 0 kB
Bounce: 0 kB
WritebackTmp: 0 kB
CommitLimit: 3538356 kB
Committed_AS: 11055620 kB
VmallocTotal: 34359738367 kB
VmallocUsed: 0 kB
VmallocChunk: 0 kB
DirectMap4k: 137820 kB
DirectMap2M: 3969024 kB
DirectMap1G: 0 kB
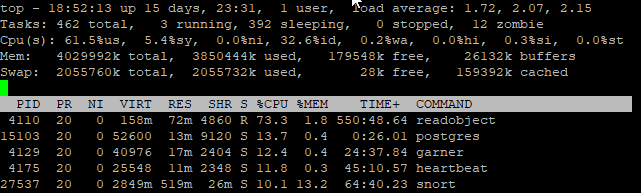
Here is `top` from the shell:
7935 20 0 3416m 1.1g 29m S 1.3 28.9 10:11.97 snort
7936 20 0 3416m 1.1g 29m S 5.3 28.9 8:48.56 snort
7934 20 0 3416m 1.1g 29m S 0.7 28.9 8:02.30 snort
7937 20 0 3416m 1.1g 29m R 1.3 28.9 8:59.75 snort
4143 20 0 1324m 1.0g 3056 S 0.0 27.7 2:27.60 snort
3768 20 0 671m 452m 436 S 0.0 11.7 1:47.96 avd
3695 20 0 505m 125m 2352 S 0.0 3.3 1:45.29 java
3817 20 0 271m 109m 1120 S 0.0 2.8 0:26.01 awarrenhttp
19144 20 0 83940 62m 33m S 0.0 1.6 0:00.81 postgres
2896 20 0 112m 43m 496 S 0.0 1.1 0:23.92 dnscache
28297 20 0 59436 40m 29m S 0.0 1.0 0:27.86 postgres
24572 20 0 50048 36m 32m S 0.0 0.9 0:04.70 postgres
I also setup a new instance of Sophos XG EAP2 in a virtual machine. Clean install with all the default security settings (IPS, application scanning, web filtering, etc.), I'm seeing about 58% memory utilization. This is with significantly more IPS, application and web policy signatures although only a single client. Additionally, this new instance of Sophos XG is only assigned 2 cores in the VM so I'm only seeing 3 instances of snort where as my primary Sophos XG install has 2 cores (but 4 threads) so I'm seeing five instances of snort. That looks like where a lot of the memory consumption is coming from.
I was always under the assumption that Sophos XG ran one instance of snort per core (or thread), at least in v17. Any reason it seems to be running an additional instance of snort?
Edit: Set all IPS and Application policies to None on my Firewall rules. Restarted Sophos XG, still sitting around 84%.
---
Sophos XG guides for home users: https://shred086.wordpress.com/
V18 is continually being tuned for performance and resource utilization. Expect to see faster speeds and optimized resources in future EAPs.
I turned all of my IPS, application and web policies back on yesterday and my memory usage was sitting around 90% like before. Oddly enough, I checked again today and now it's around 81%. So for anyone installing the v18 EAP, might be worth just giving it a few days to see where it ends up.
---
Sophos XG guides for home users: https://shred086.wordpress.com/
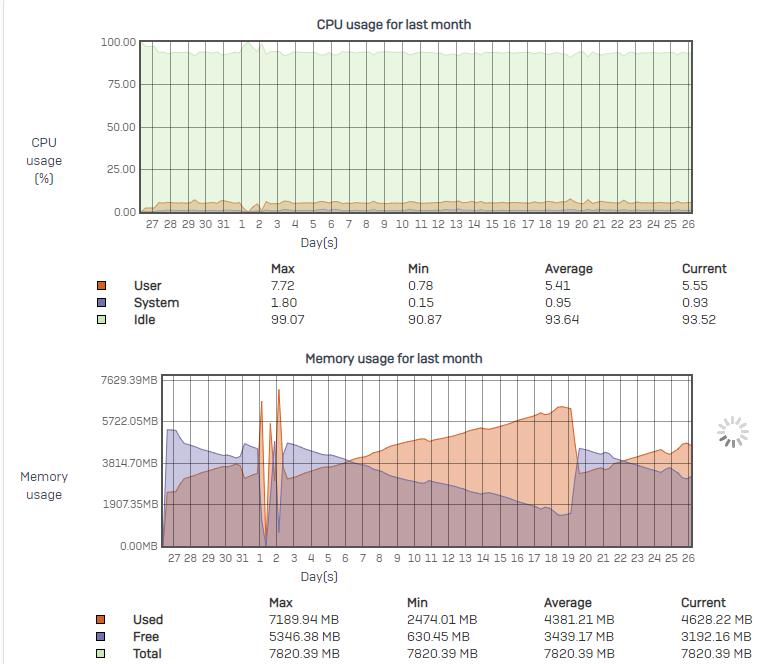
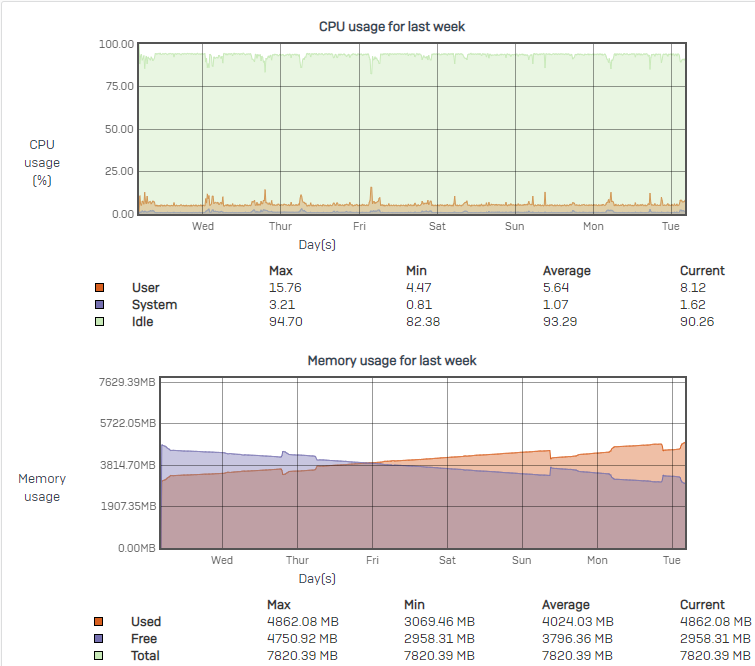
Having fun looking at my memory utilisation. Soon, it will be topped as before EAP2.
Paul Jr

Fascinating graphs - wonder why those saw bumps in memory usage are there. My (home) XG125 with it's 4 Gigs only is running quite stable with a quite high, but stable mem usage. It's mainly handling family traffic, some intermittent guests and tons of IoT devices.
Very obvious is the load drop after EAP2 installation.
The box has quite everything active, SyncSec, WAF, DPI, WIFI, IPS, AppControl, OSPF etc...
And I just found a bug too - seems that the various RED tunnels and the RED15W aren't shown in the dashboard at all (0/0)
In my case I have little bit headache, that swap space obviously is in use 100%. Will dig little deeper in a spare minute, which process(es) are swapping so much...
However - the EAP2 is running anyway fluid and without issues for me personally so far. I will have a look later which processes sucks away that memory....

I'm sure you already know but using top, you can do a "Shift-O" and select "n" and press Enter to sort by %MEM. It's definitely the five instances of snort running that's consuming most of the memory.
I just upgraded from 4GB to 8GB. Showing 42% memory usage and 0k of swap used. But like you mentioned, EAP2 was running stable for me as well with 4GB, 90% memory usage and a bunch of swap memory being used.
I really hope Sophos allows Home users to utilize up to 8GB with v18.
---
Sophos XG guides for home users: https://shred086.wordpress.com/
Hi Shred,
Snort does show substantial memory usage but actually all instances of Snort are actually sharing the same memory locations so those 5 instances (like in my 4 core box) are all using the same 500MB portion of memory.
Emile