
Introducing the EAP release for our latest integration; Splunk for Sophos (XG) firewall.
Splunk provides an excellent compliment to Sophos Central cloud-based reporting for on-premise data storage, dashboarding and reporting of firewall log data.
|
*Note: This beta installer is provided to our partners and customers solely for the purpose of testing and feedback. Upon completion of the EAP phase, these installation files will be deleted from this location. The GA (Generally Available) installers will be made available for download free of charge from the Splunkbase marketplace upon announcement of official release. By clicking download, you agree to the Sophos API & Plugins Terms of Use. You also acknowledge that Sophos processes personal data in accordance with the Sophos Privacy Policy. |
Table of Contents
- Plugin Overview
- Installation & Setup
- Configuration
- CIM Reference
- Dashboard source types
- Troubleshooting & Logging
- Help & Support
Plugin Overview
This integration consists of 2 Splunk applications:
- Sophos (XG) Firewall Add-on For Splunk (TA): The TA, parses the required data collected from the Sophos Firewall platform. Extracts the required fields from the logs and maps the collected data to several CIM data models of Splunk.
- Sophos App For Splunk (App): The App provides a series of dashboards providing a wealth of data categorized across security, network, user, and VPN.
- TA is a prerequisite for the visualization App.
An overview of the dashboard Apps are provided below.
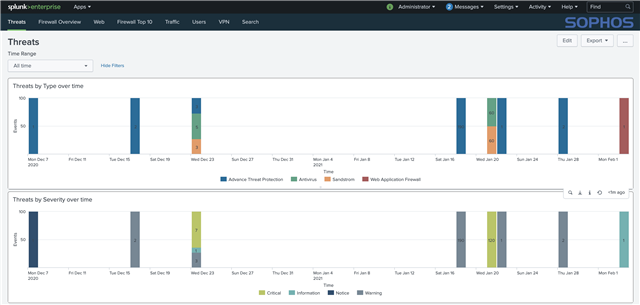
Threat Dashboard - Use this dashboard to understand threat trends and view threats by type, severity and Source IP over time
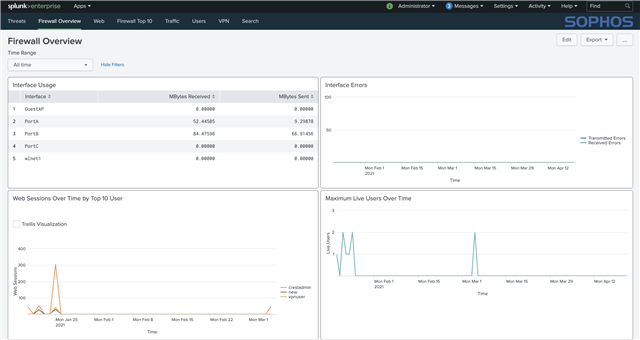
Firewall Overview - Quickly determine usage trends of your firewall device with widgets such as Interface Usage and Web Sessions over time.
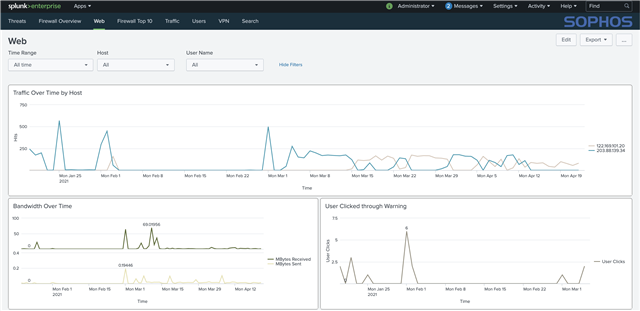
Web - Provides a snapshot view of web trends and usage over time
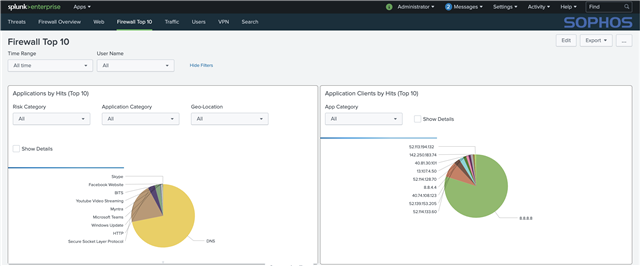
Firewall Top 10 - See top trends across application and traffic usage
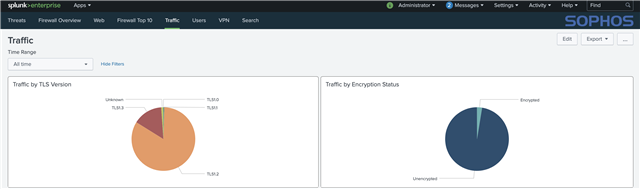
Traffic - Provides a deeper dive into traffic analysis and visualization
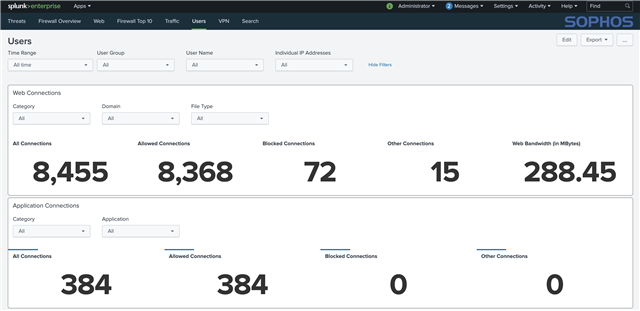
Users - View and filter user interactions by time, group, name and IP address
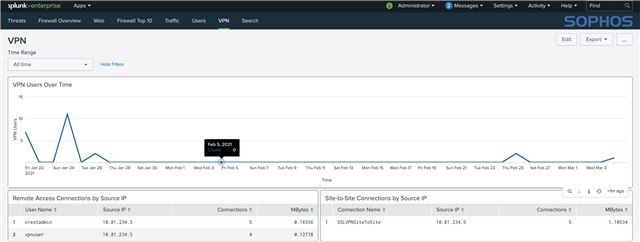
VPN - View VPN trends such as Usage Over Time, Connection Types, and Web Categories accessed via VPN
Installation & Setup
Compatibility matrix
|
Browser |
Google Chrome, Mozilla Firefox |
|
Operating System |
CentOS, Ubuntu, Windows |
|
Splunk Products |
Splunk Enterprise, Splunk Cloud |
|
Splunk Enterprise Version |
8.1.x, 8.0.x, 7.3.x |
|
Splunk CIM Version |
4.18.1 |
|
Product Version |
SFOS 18.0.1 MR-1-Build396 or later |
System requirements & Installation
Capacity Planning
- Please adhere to the Spunk recommended system requirements for both applications.
Installation methods
Based on your Splunk deployment as determined from your capacity planning, follow the steps below to install the Splunk applications as either a Stand alone or Distributed instance.
If you are using “Distributed Splunk Deployment”, refer to the below tables to determine where to install your respective applications.
Sophos (XG) Firewall Add-on For Splunk
|
Splunk Instance Type |
Required |
Description |
|
Heavy Forwarder/Universal Forwarder |
Yes |
The TA can either be installed on a heavy forwarder or universal forwarder. |
|
Indexer/Indexer Cluster |
Conditional |
Not required if you use heavy forwarders to collect data. Required if you use universal forwarders to collect data. |
|
Search Head/Search Head Cluster |
Yes |
Yes |
Sophos App For Splunk
|
Splunk Instance Type |
Required |
Description |
|
Heavy Forwarder/Universal Forwarder |
No |
- |
|
Indexer/Indexer Cluster |
No |
- |
|
Search Head/Search Head Cluster |
Yes |
Yes |
Configuration
Once the installation of the Sophos (XG) Firewall Add-on For Splunk is done successfully, follow these steps to configure:
Configure your SFOS device to Forward Logs
- Login to your Sophos (XG) Firewall.
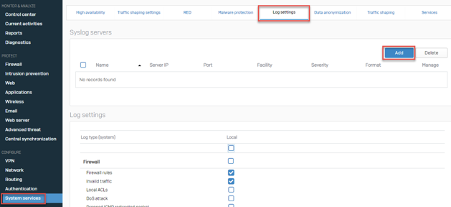
- Go to System Services > Log Settings and click Add to set the Splunk server.
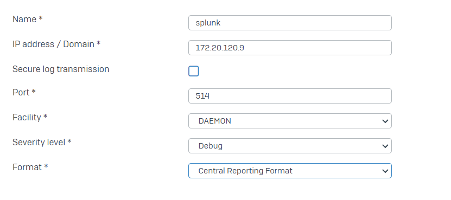
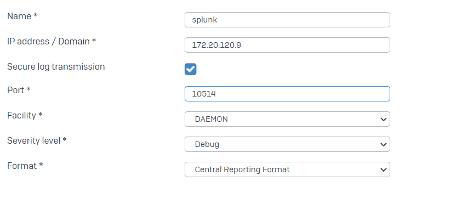
- Complete all fields based on the two available configuration options below and click Save.
Configuration settings to forward logs over UDP
Configuration settings to forward logs over secure TCP
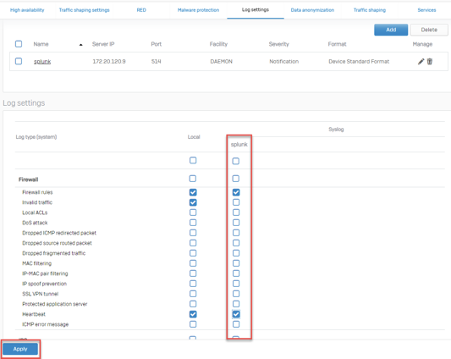
- Under the Log Settings tab, you should have a column labeled splunk, check all of the event types you would like to send to the splunk server and click Apply.
Configure Splunk to Receive Firewall Logs
The Sophos (XG) Firewall Add-on For Splunk manages inputs through TCP or UDP inputs provided by Splunk. To configure inputs follow the respective instructions below
- Inputs over UDP
- Login to Splunk WEB UI.
- Navigate to “Settings > Data inputs.
- Choose UDP and click New.
- In the left pane, click TCP / UDP to add an input.
- Click the UDP button to choose a UDP input.
- In the Port field, enter a port number on which you are forwarding the logs from Sophos XG Firewall device.
- In the Source name override field, enter a new source name to override the default source value, if necessary.
- Click Next to continue to the Input Settings page.
- Set the Source type to “sophos:xg:logs” for UDP.
- Set App context to “TA-sophos_xg_firewall”.
- Set the Host to either IP or DNS. This value will be reflected in the host field of the events. This should be the name of the machine from which the event originates.
- Set the Index that Splunk Enterprise should send data to for this input.
- Click Review.
- Click Submit once you have ensured everything is correct.
- Inputs over TCP
- To set up a secure tcp port user needs to add inputs.conf file into TA-sophos_xg_firewall.
- Create inputs.conf file from below example and copy it to $SPLUNK_HOME/etc/apps/TA-sophos_xg_firewall/local/inputs.conf
- If a local folder does not exist create one and restart Splunk.
- Once the input is configured, execute “index=<configured_index> sourcetype=<>” query to validate that the events are being received.
- Example inputs.conf
[SSL]

requireClientCert = false

rootCA = $SPLUNK_HOME/etc/auth/ca.pem # Location of root CA

serverCert = $SPLUNK_HOME/etc/auth/server.pem # Location of server certificate

password = <password of server.pem file>

[tcp-ssl://10514] # tcp-ssl://<port number>

index = main # index on which logs will be inserted

sourcetype = sophos:xg:logs:secure # Do not change sourcetype
To use the CIM mapped fields, the user first needs to configure the event type to provide the index in which the data is being collected. To configure event type:
- Navigate to Settings > Event types.
- Select “Sophos XG Firewall Add-on For Splunk” from the App dropdown.
- Click on sophosxg_idx.
- Update “index=main” with “index=<your_configured_index>” in the existing definition to use your configured index.
- Click Save.
Configuration of Sophos Firewall Dashboards App for Splunk
Once the installation of the Sophos App For Splunk is done successfully, follow below steps to configure:
Configure Macro on Splunk Search Head Instance
The user needs to update the provided macro to use the index in which Sophos data is getting collected. To configure macro:
- Navigate to Settings > Advanced search > Search macros.
- Select “Sophos App For Splunk” from the App dropdown.
- Click on sophosxgindex.
- Update “index=main” with “index=<your_configured_index>” in the existing macro definition to use your configured index.
- Click Save.
CIM Reference
Please see this post for a detailed table of how the data collected from the Sophos (XG) Firewall maps to the Network Traffic Common Information Data Model from Splunk.
Dashboard source types
Sophos Dashboard App For Splunk provides 7 dashboards and several visualizations to provide user insights into the data collected from the Sophos (XG) Firewall platform. The linked post provides a table mapping of panel visualization names to source types found in each dashboard.
Troubleshooting & Logging
Currently the following three event log types are not supported in the ingestor APP (TA)
- Authentication events to the SFOS device
- SFOS system state logs
- Email Anti-Spam events
Help & Support
Support for this application while in Early Access will be provided via the Feedback forum associated with this Wiki. Please use an existing post if your issue has already been reported, or create a new post for each new issue you wish to report.
