

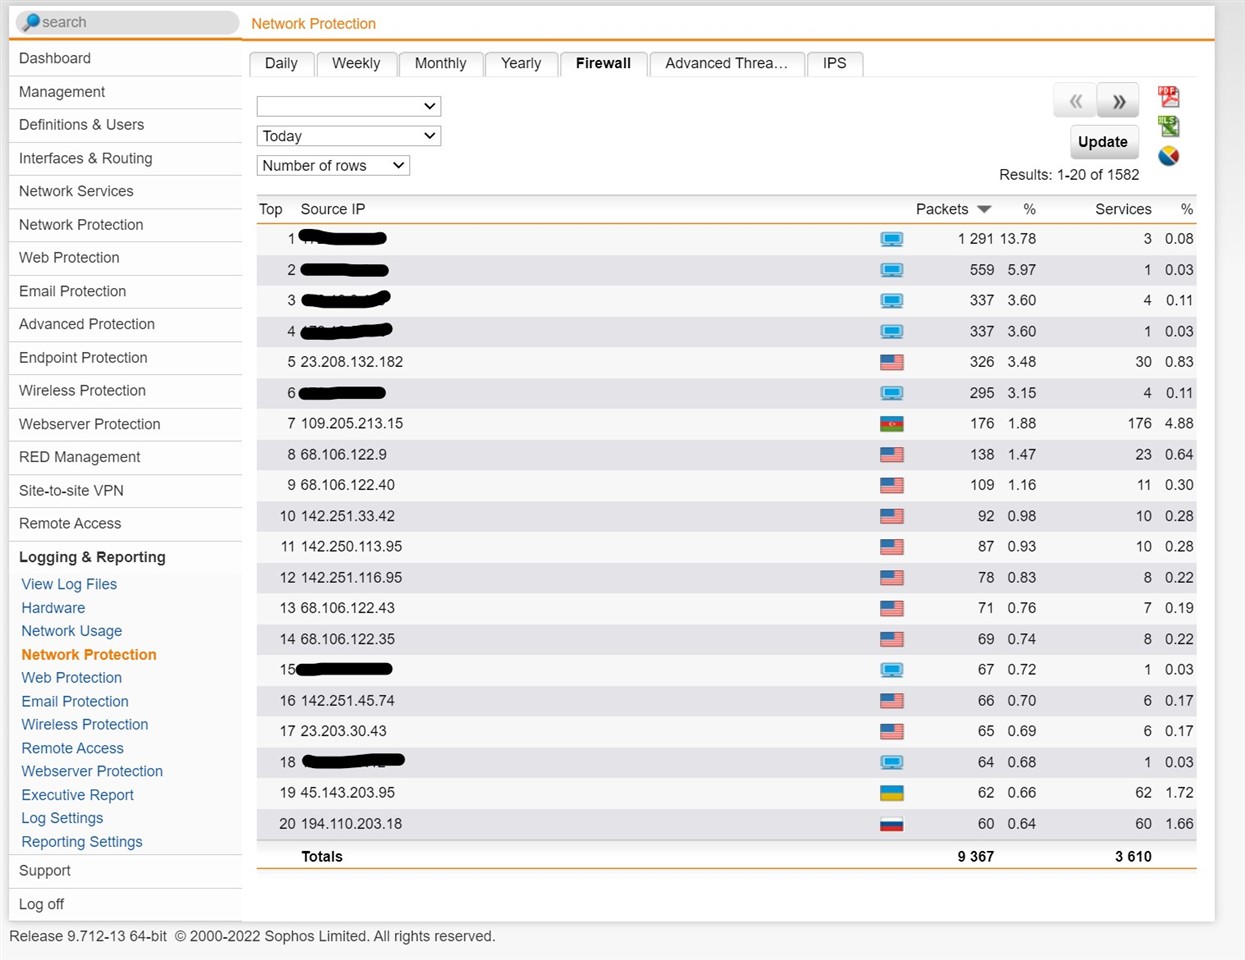
This is what my Firewall graph should look like (blocked out lines are my IPs):
But now, when I hit the arrows to scroll at the top right of the screen, I get this:
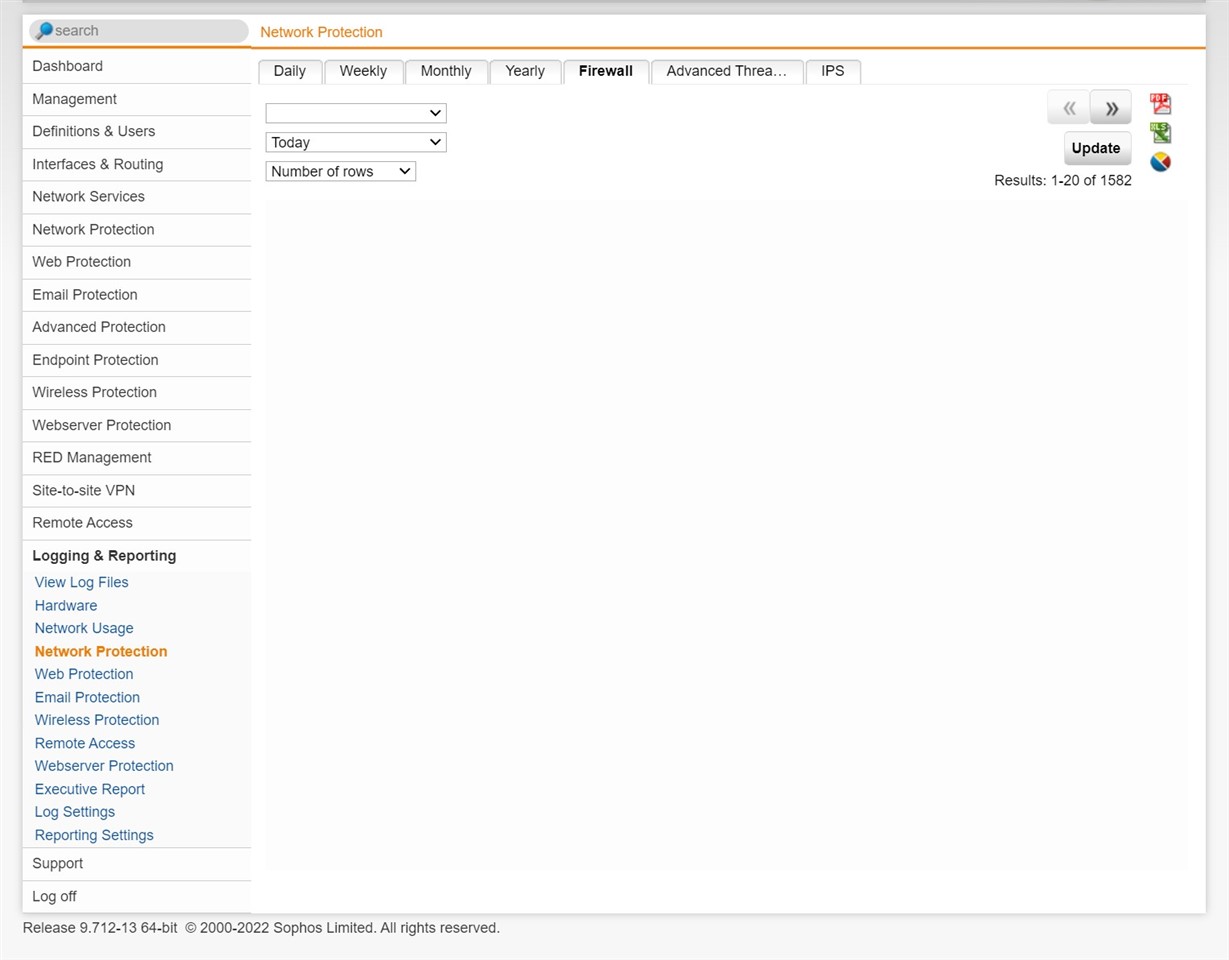
These two screenshots were taken moments apart on the same day (today). If I switch tabs, the information will stay blank unless I go back to the Firewall tab, or just get out of this completely and go back into Logging & Reporting.
Exporting as CSV shows all of the information but everything is pushed into one column in Excel and not broken out.
EDIT: Thank you for fixing the forum so we can post screenshots again.
This thread was automatically locked due to age.

