This discussion has been locked.
You can no longer post new replies to this discussion. If you have a question you can start a new discussion

SG 430 (Home Licence) Crashing/Freezing

Hi, 

I have a second hand SG 430, running with a home licence. Firmware version = 9.711-5. It has been running for over a year with no issues.

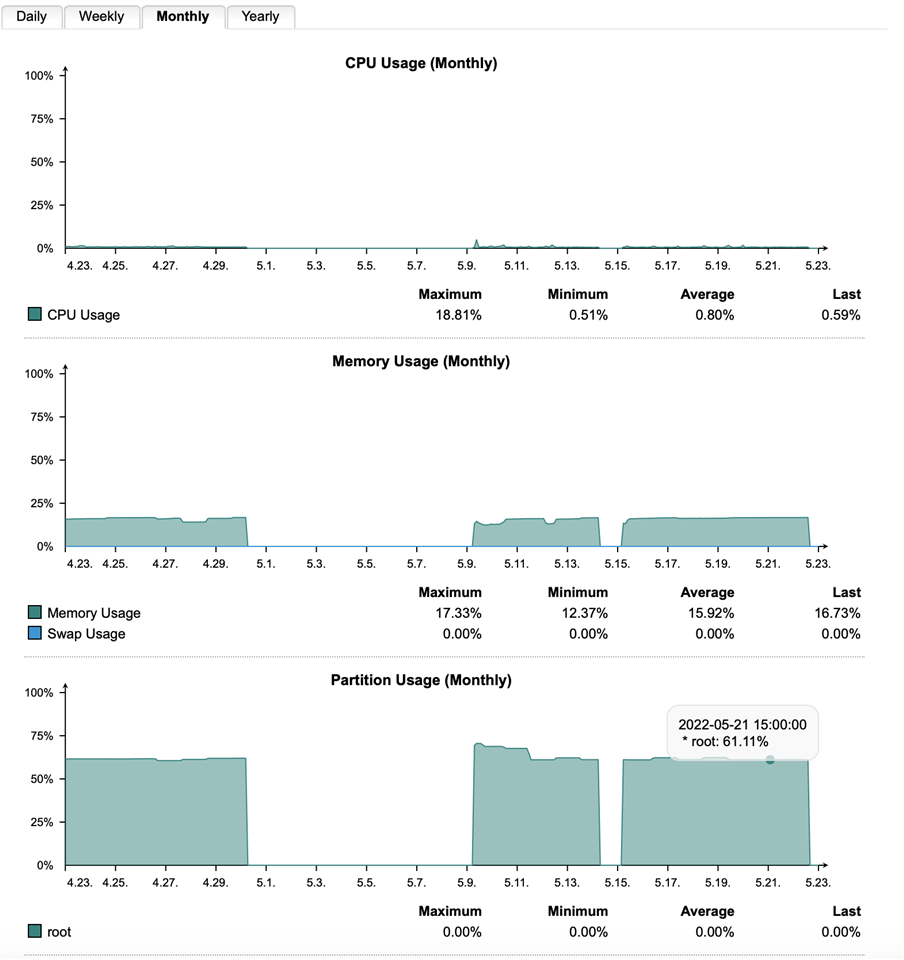
 However, since the beginning of May, it has crashed/frozen 3 times. (see attached picture of hardware usage - 3rd time was today). When it freezes, WebAdmin is unavailable, internet access is unavailable, VPN is unavailable, etc. Even the joystick control on the front of the SG 430 doesn't do anything. Only way to fix is to power off at the wall and then power back on. 

There seems to be no regularity to the crashes. I have checked the SMART status of the hard disk, which appears to have passed.

I'm wondering how to troubleshoot this issue? Is it likely to be a hardware or software issue? I'm thinking of completely re-installing UTM software, and then restoring configuration from Back-Up. Any advice would be greatly appreciated. 

Many thanks 


This thread was automatically locked due to age.
Parents
  • Hello Handel078,

    Thank you for reaching out to community, check the disk usage with via command line interface: 
    > df -kh
    > and check the postgres status with the help of the command:  ps -aux | grep postgres
    > additionally, check the /var/logsystem.log , /var/log/kernel.log and /var/log/fallback.log 

    Thanks & Regards,
    _______________________________________________________________

    Vivek Jagad | Team Lead, Technical Support, Global Customer Experience

    Log a Support Case | Sophos Service Guide
    Best Practices – Support Case  | Security Advisories 
    Compare Sophos next-gen Firewall | Fortune Favors the prepared
    Sophos Community | Product Documentation | Sophos Techvids | SMS
    If a post solves your question please use the 'Verify Answer' button.

  • Hi Vivek, 

    Thank you for helping. It crashed again overnight. Before rebooting, the red LED light on the hard-drive indicator on the front of the box was not on or flashing, and there was no response to any commands executed directly on the console (USB keyboard and VGA screen). However, the joystick did scroll through the menus on the little LCD screen. When I selected the reboot command, it said "rebooting now..." however nothing actually occurred.

    I hard rebooted via power socket, and tried your suggestions. Here are the outputs. (I'm not an expert in deciphering the logs, so any help interpreting them would be much appreciated).

    Many thanks,

    1. Disk Usage:


    utm:/root # df -kh
    Filesystem                        Size  Used Avail Use% Mounted on
    /dev/sda6                         5.2G  3.2G  1.8G  65% /
    udev                              7.8G   96K  7.8G   1% /dev
    tmpfs                             7.8G  112K  7.8G   1% /dev/shm
    /dev/sda1                         331M   16M  295M   5% /boot
    /dev/sda5                          84G  2.7G   77G   4% /var/storage
    /dev/sda7                         110G  2.4G  101G   3% /var/log
    /dev/sda8                         4.6G  9.5M  4.3G   1% /tmp
    /dev                              7.8G   96K  7.8G   1% /var/storage/chroot-clientlessvpn/dev
    tmpfs                             7.8G     0  7.8G   0% /var/sec/chroot-httpd/dev/shm
    /dev                              7.8G   96K  7.8G   1% /var/sec/chroot-openvpn/dev
    /dev                              7.8G   96K  7.8G   1% /var/sec/chroot-ppp/dev
    /dev                              7.8G   96K  7.8G   1% /var/sec/chroot-pppoe/dev
    /dev                              7.8G   96K  7.8G   1% /var/sec/chroot-pptp/dev
    /dev                              7.8G   96K  7.8G   1% /var/sec/chroot-pptpc/dev
    /dev                              7.8G   96K  7.8G   1% /var/sec/chroot-restd/dev
    tmpfs                             7.8G     0  7.8G   0% /var/storage/chroot-reverseproxy/dev/shm
    /var/storage/chroot-smtp/spool     84G  2.7G   77G   4% /var/sec/chroot-httpd/var/spx/spool
    /var/storage/chroot-smtp/spx       84G  2.7G   77G   4% /var/sec/chroot-httpd/var/spx/public/images/spx
    tmpfs                             7.8G  157M  7.7G   2% /var/storage/chroot-http/tmp
    /var/sec/chroot-afc/var/run/navl  5.2G  3.2G  1.8G  65% /var/storage/chroot-http/var/run/navl
    tmpfs                             7.8G   60K  7.8G   1% /var/storage/chroot-smtp/tmp/ram
    /etc/nwd.d/route                  5.2G  3.2G  1.8G  65% /var/sec/chroot-ipsec/etc/nwd.d/route
    

    2. Postgres

    utm:/root # ps -aux | grep postgres
    Warning: bad ps syntax, perhaps a bogus '-'? See http://procps.sf.net/faq.html
    postgres  4274  0.0  0.4 2210548 81504 ?       S    10:45   0:00 /usr/pgsql92-64/bin/postgres -D /var/storage/pgsql92/data
    postgres  4285  0.0  0.1 2211732 17276 ?       Ss   10:45   0:00 postgres: checkpointer process                           
    postgres  4286  0.0  0.0 2211576 14148 ?       Ss   10:45   0:00 postgres: writer process                                 
    postgres  4287  0.0  0.0 2211576 4900 ?        Ss   10:45   0:00 postgres: wal writer process                             
    postgres  4288  0.0  0.0 2212688 2400 ?        Ss   10:45   0:00 postgres: autovacuum launcher process                    
    postgres  4289  0.0  0.0  26932   620 ?        Ss   10:45   0:00 postgres: archiver process                               
    postgres  4290  0.0  0.0  27212  1104 ?        Ss   10:45   0:00 postgres: stats collector process                        
    postgres  5280  0.0  0.0 2217832 12632 ?       Ss   10:45   0:00 postgres: reporting reporting [local] idle               
    postgres  5806  0.0  0.0 2214312 5184 ?        Ss   10:45   0:00 postgres: smtp smtp [local] idle                         
    postgres  5807  0.0  0.0 2214312 5120 ?        Ss   10:45   0:00 postgres: smtp smtp [local] idle                         
    postgres  5844  0.0  0.1 2218788 19472 ?       Ss   10:45   0:00 postgres: reporting reporting [local] idle               
    postgres  5845  0.0  0.0 2214976 4916 ?        Ss   10:45   0:00 postgres: reporting reporting [local] idle               
    postgres  5856  0.0  0.0 2215072 5912 ?        Ss   10:45   0:00 postgres: hotspot hotspot [local] idle                   
    postgres  5901  0.0  0.0 2215072 5848 ?        Ss   10:45   0:00 postgres: hotspot hotspot [local] idle                   
    postgres  6045  0.0  0.0 2215064 6264 ?        Ss   10:45   0:00 postgres: smtp smtp 127.0.0.1(44532) idle                
    postgres  6076  0.0  0.0 2214968 5624 ?        Ss   10:45   0:00 postgres: smtp smtp 127.0.0.1(44535) idle                
    postgres  7165  0.0  0.0 2214852 5148 ?        Ss   10:46   0:00 postgres: sandbox sandbox [local] idle                   
    postgres  7181  0.0  0.0 2214988 5956 ?        Ss   10:46   0:00 postgres: sandbox sandbox [local] idle                   
    postgres  8319  0.0  0.0 2215132 6960 ?        Ss   10:50   0:00 postgres: smtp smtp 127.0.0.1(44630) idle                
    root      8490  0.0  0.0   5672   748 pts/0    S+   10:52   0:00 grep postgres
    

    3. Logs around the crash time 

    A) system.log (one of my WAN interfaces is a 4G connection, in the 10.179.x.x range)

    2022:05:24-04:34:44 utm dhclient: DHCPREQUEST for 10.179.255.180 on eth1 to 10.179.255.181 port 67
    2022:05:24-04:34:44 utm dhclient: DHCPACK of 10.179.255.180 from 10.179.255.181
    2022:05:24-04:34:44 utm dhclient: bound to 10.179.255.180 -- renewal in 32 seconds.
    2022:05:24-04:34:56 utm dns-resolver[4969]: No change to REF_NetDnsSmtpGmail :: smtp.gmail.com
    2022:05:24-04:35:01 utm /usr/sbin/cron[1040]: (root) CMD (   /usr/local/bin/reporter/system-reporter.pl)
    2022:05:24-04:35:01 utm /usr/sbin/cron[1041]: (httpproxy) CMD (/var/chroot-http/usr/bin/virus_feedback_uploader)
    2022:05:24-04:35:16 utm dhclient: DHCPREQUEST for 10.179.255.180 on eth1 to 10.179.255.181 port 67
    2022:05:24-04:35:16 utm dhclient: DHCPACK of 10.179.255.180 from 10.179.255.181
    2022:05:24-04:35:16 utm dhclient: bound to 10.179.255.180 -- renewal in 25 seconds.
    2022:05:24-04:35:41 utm dhclient: DHCPREQUEST for 10.179.255.180 on eth1 to 10.179.255.181 port 67
    2022:05:24-04:35:41 utm dhclient: DHCPACK of 10.179.255.180 from 10.179.255.181
    2022:05:24-04:35:41 utm dhclient: bound to 10.179.255.180 -- renewal in 25 seconds.
    2022:05:24-04:35:57 utm dns-resolver[4969]: No change to REF_NetDnsAppleNtp :: time.apple.com
    2022:05:24-04:36:06 utm dhclient: DHCPREQUEST for 10.179.255.180 on eth1 to 10.179.255.181 port 67
    2022:05:24-04:36:06 utm dhclient: DHCPACK of 10.179.255.180 from 10.179.255.181
    2022:05:24-04:36:06 utm dhclient: bound to 10.179.255.180 -- renewal in 32 seconds.
    2022:05:24-04:36:38 utm dhclient: DHCPREQUEST for 10.179.255.180 on eth1 to 10.179.255.181 port 67
    2022:05:24-04:36:38 utm dhclient: DHCPACK of 10.179.255.180 from 10.179.255.181
    2022:05:24-04:36:39 utm dhclient: bound to 10.179.255.180 -- renewal in 31 seconds.
    2022:05:24-04:36:57 utm dns-resolver[4969]: Updating REF_NetDnsSmtpGmail :: smtp.gmail.com
    2022:05:24-04:37:10 utm dhclient: DHCPREQUEST for 10.179.255.180 on eth1 to 10.179.255.181 port 67
    2022:05:24-04:37:10 utm dhclient: DHCPACK of 10.179.255.180 from 10.179.255.181
    2022:05:24-04:37:10 utm dhclient: bound to 10.179.255.180 -- renewal in 25 seconds.
    2022:05:24-10:45:28 utm syslog-ng[5342]: syslog-ng starting up; version='3.4.7'
    2022:05:24-10:45:29 utm ntpd[5083]: Listen normally on 12 tun0 10.242.2.1:123
    2022:05:24-10:45:29 utm ntpd[5083]: new interface(s) found: waking up resolver
    2022:05:24-10:45:33 utm dns-resolver[4982]: DNS server failed to contact!
    2022:05:24-10:45:33 utm dns-resolver[4982]: DNS server failed to contact!
    2022:05:24-10:45:43 utm dhclient: DHCPDISCOVER on eth1 to 255.255.255.255 port 67 interval 6
    2022:05:24-10:45:44 utm dhclient: DHCPOFFER of 10.179.255.180 from 10.179.255.181
    2022:05:24-10:45:44 utm dhclient: DHCPREQUEST for 10.179.255.180 on eth1 to 255.255.255.255 port 67
    2022:05:24-10:45:44 utm dhclient: DHCPACK of 10.179.255.180 from 10.179.255.181
    2022:05:24-10:45:44 utm dhclient: bound to 10.179.255.180 -- renewal in 27 seconds.

    B) kernel.log only has data from after the reboot. 

    C) fallback.log

    2022:05:24-04:30:57 utm [daemon:info] dhcp_updown[819]:  dhcp_updown: No IPv4 address change, exiting
    2022:05:24-04:31:25 utm [daemon:info] dhcp_updown[841]:  eth1 - reason:RENEW
    2022:05:24-04:31:25 utm [daemon:info] dhcp_updown[841]:  dhcp_updown: No IPv4 address change, exiting
    2022:05:24-04:31:52 utm [daemon:info] dhcp_updown[857]:  eth1 - reason:RENEW
    2022:05:24-04:31:52 utm [daemon:info] dhcp_updown[857]:  dhcp_updown: No IPv4 address change, exiting
    2022:05:24-04:32:22 utm [daemon:info] dhcp_updown[921]:  eth1 - reason:RENEW
    2022:05:24-04:32:22 utm [daemon:info] dhcp_updown[921]:  dhcp_updown: No IPv4 address change, exiting
    2022:05:24-04:32:50 utm [daemon:info] dhcp_updown[937]:  eth1 - reason:RENEW
    2022:05:24-04:32:50 utm [daemon:info] dhcp_updown[937]:  dhcp_updown: No IPv4 address change, exiting
    2022:05:24-04:33:19 utm [daemon:info] dhcp_updown[951]:  eth1 - reason:RENEW
    2022:05:24-04:33:19 utm [daemon:info] dhcp_updown[951]:  dhcp_updown: No IPv4 address change, exiting
    2022:05:24-04:33:48 utm [daemon:info] dhcp_updown[968]:  eth1 - reason:RENEW
    2022:05:24-04:33:48 utm [daemon:info] dhcp_updown[968]:  dhcp_updown: No IPv4 address change, exiting
    2022:05:24-04:34:18 utm [daemon:info] dhcp_updown[987]:  eth1 - reason:RENEW
    2022:05:24-04:34:18 utm [daemon:info] dhcp_updown[987]:  dhcp_updown: No IPv4 address change, exiting
    2022:05:24-04:34:44 utm [daemon:info] dhcp_updown[1004]:  eth1 - reason:RENEW
    2022:05:24-04:34:44 utm [daemon:info] dhcp_updown[1004]:  dhcp_updown: No IPv4 address change, exiting
    2022:05:24-04:35:16 utm [daemon:info] dhcp_updown[1115]:  eth1 - reason:RENEW
    2022:05:24-04:35:16 utm [daemon:info] dhcp_updown[1115]:  dhcp_updown: No IPv4 address change, exiting
    2022:05:24-04:35:41 utm [daemon:info] dhcp_updown[1131]:  eth1 - reason:RENEW
    2022:05:24-04:35:41 utm [daemon:info] dhcp_updown[1131]:  dhcp_updown: No IPv4 address change, exiting
    2022:05:24-04:36:06 utm [daemon:info] dhcp_updown[1158]:  eth1 - reason:RENEW
    2022:05:24-04:36:06 utm [daemon:info] dhcp_updown[1158]:  dhcp_updown: No IPv4 address change, exiting
    2022:05:24-04:36:39 utm [daemon:info] dhcp_updown[1178]:  eth1 - reason:RENEW
    2022:05:24-04:36:39 utm [daemon:info] dhcp_updown[1178]:  dhcp_updown: No IPv4 address change, exiting
    2022:05:24-04:37:10 utm [daemon:info] dhcp_updown[1208]:  eth1 - reason:RENEW
    2022:05:24-04:37:10 utm [daemon:info] dhcp_updown[1208]:  dhcp_updown: No IPv4 address change, exiting
    2022:05:24-10:45:34 utm [daemon:info] irqd[3749]:  received SIGTERM
    2022:05:24-10:45:34 utm [daemon:info] irqd[6302]:  getting interface notifications
    2022:05:24-10:45:34 utm [daemon:info] irqd[6302]:  lo loopback <loopback,up,running,lowerup> group 0 
    2022:05:24-10:45:34 utm [daemon:info] irqd[6302]:  RPS enabled, XPS enabled
    2022:05:24-10:45:34 utm [daemon:info] irqd[6302]:  lo: detected 1 queue(s), 'network' cpuset
    2022:05:24-10:45:34 utm [daemon:info] irqd[6302]:  lo:0: affinity irq=0x3 rps/xps=0x3
    2022:05:24-10:45:34 utm [daemon:info] irqd[6302]:  lo: up

  • Any will be fine, either you do it with ssh or serial cable... 

    Thanks & Regards,
    _______________________________________________________________

    Vivek Jagad | Team Lead, Technical Support, Global Customer Experience

    Log a Support Case | Sophos Service Guide
    Best Practices – Support Case  | Security Advisories 
    Compare Sophos next-gen Firewall | Fortune Favors the prepared
    Sophos Community | Product Documentation | Sophos Techvids | SMS
    If a post solves your question please use the 'Verify Answer' button.

  • Thanks - have set up. Will report back with details once it crashes again....!

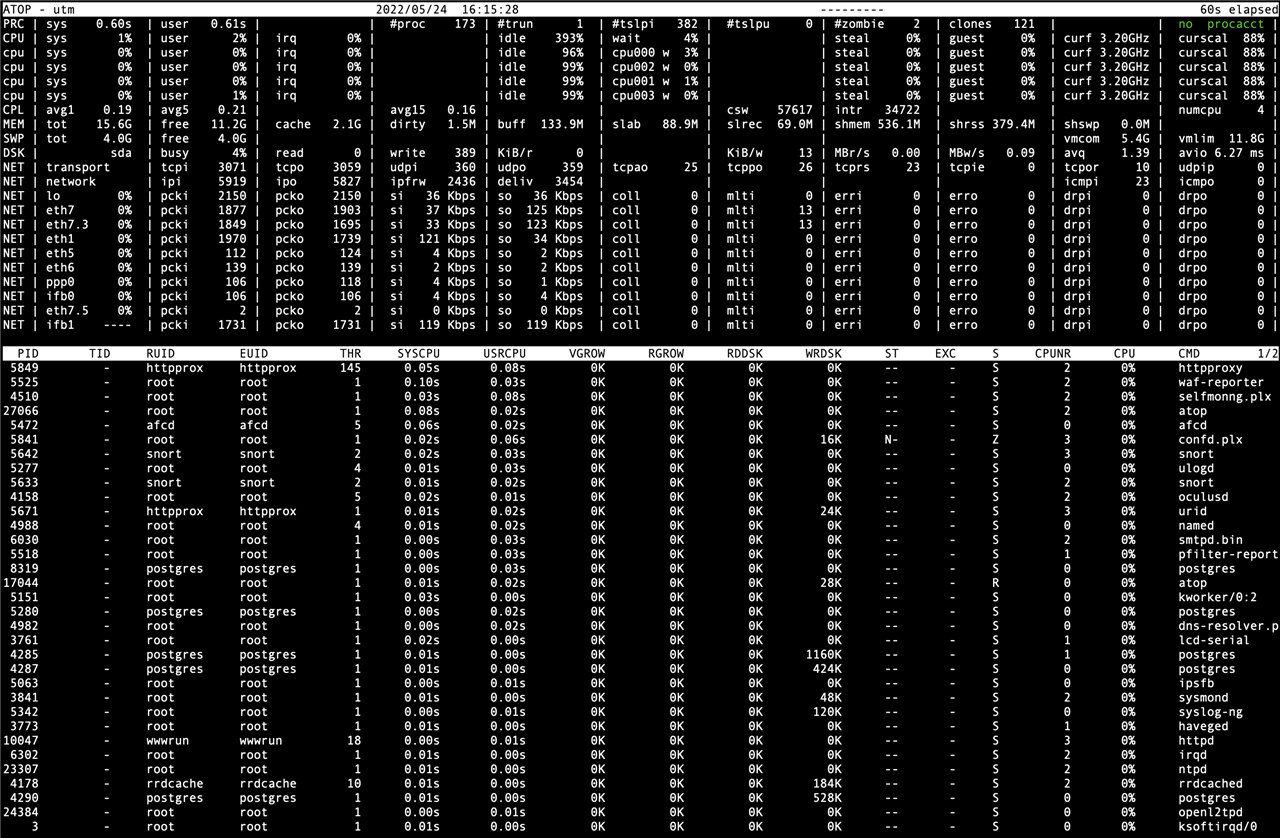
  • Okay, so it has crashed again. at around 16:26. Having rebooted, I've been back to look at the atop log. This has only saved output until 16:15 and seems to show normal activity. (See image 1). 

    (Image 1)

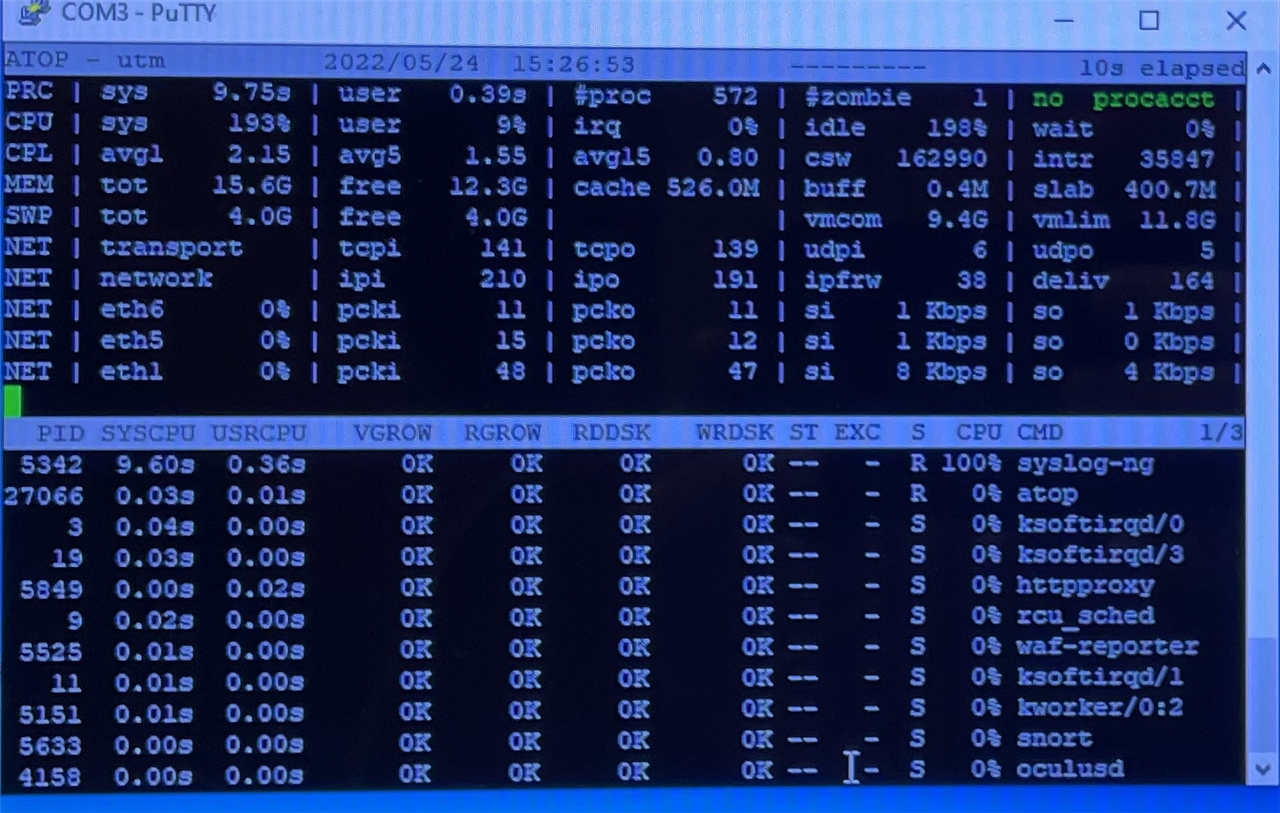
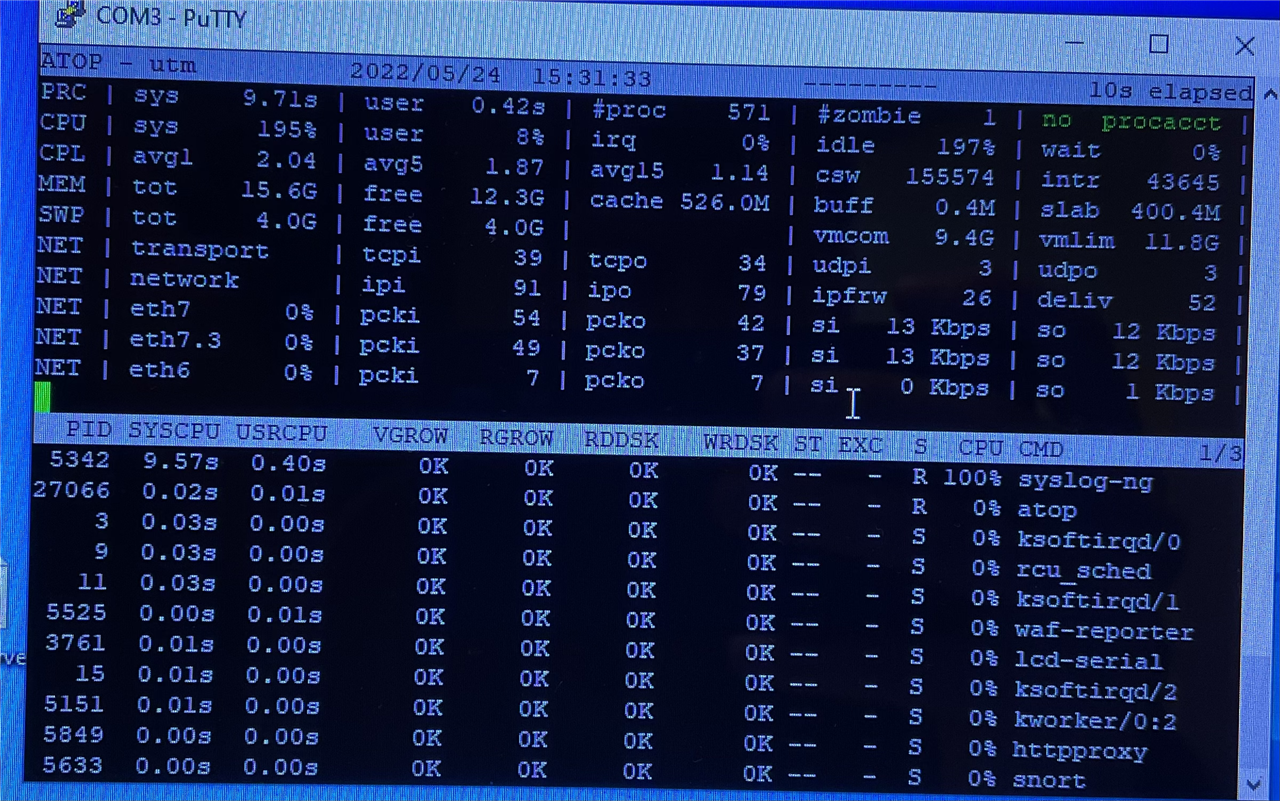
    However, I was also running atop "live" on a putty session which seemed to show (although at the wrong time!!!??) syslog-ng at 100% CPU. See (images 2 & 3)

    (Image 2)

    (Image 3)

    Does this help in diagnosing the problem? Many thanks

  • Thank you for the update, could you please provide us an output of: 
    # version

    Thanks & Regards,
    _______________________________________________________________

    Vivek Jagad | Team Lead, Technical Support, Global Customer Experience

    Log a Support Case | Sophos Service Guide
    Best Practices – Support Case  | Security Advisories 
    Compare Sophos next-gen Firewall | Fortune Favors the prepared
    Sophos Community | Product Documentation | Sophos Techvids | SMS
    If a post solves your question please use the 'Verify Answer' button.

  • Current software version...: 9.711005

    Hardware type..............: 430r1

    Serial number..............: XXXXXXXXXXXXXXXX

    Installation image.........: 9.705-3.1

    Installation type..........: ssi

    Installed pattern version..: 208791

    Downloaded pattern version.: 208791

    Up2Dates applied...........: 7 (see below)

                                 sys-9.705-9.705-3.7.1.tgz (May 25  2021)

                                 sys-9.705-9.706-7.9.2.tgz (Jun 25  2021)

                                 sys-9.706-9.707-9.5.1.tgz (Jul 31  2021)

                                 sys-9.707-9.708-5.6.1.tgz (Feb 24 11:30)

                                 sys-9.708-9.709-6.3.1.tgz (Feb 26 20:23)

                                 sys-9.709-9.710-3.1.1.tgz (Apr 22 16:34)

                                 sys-9.710-9.711-1.5.1.tgz (May 10 04:00)

    Up2Dates available.........: 0

    Factory resets.............: 0

    Timewarps detected.........: 4

  • Also check if there are coredumps for this freeze instance occurred so far: 
    >#  ls -ll /var/storage/cores

    Thanks & Regards,
    _______________________________________________________________

    Vivek Jagad | Team Lead, Technical Support, Global Customer Experience

    Log a Support Case | Sophos Service Guide
    Best Practices – Support Case  | Security Advisories 
    Compare Sophos next-gen Firewall | Fortune Favors the prepared
    Sophos Community | Product Documentation | Sophos Techvids | SMS
    If a post solves your question please use the 'Verify Answer' button.

  • This is the output from that...

    utm:/root # ls -ll /var/storage/cores

    total 44268

    -rw-r--r-- 1 root root 45330432 Jun 25  2021 confd.plx.18185

  • There are no coredumps either. What are the modules/ services you are using on the current home edition ?

    Thanks & Regards,
    _______________________________________________________________

    Vivek Jagad | Team Lead, Technical Support, Global Customer Experience

    Log a Support Case | Sophos Service Guide
    Best Practices – Support Case  | Security Advisories 
    Compare Sophos next-gen Firewall | Fortune Favors the prepared
    Sophos Community | Product Documentation | Sophos Techvids | SMS
    If a post solves your question please use the 'Verify Answer' button.

  • Currently using: (as per current system config on dashboard)

    Firewall, Intrusion Prevention, Web Filtering, Application Control, Remote Access, AntiVirus & AntiSpyware.

  • Check for any hardware errors:  cat /var/log/*.log | grep I/O

    we can also try re-building the database or re-image the appliance: https://support.sophos.com/support/s/article/KB-000034331?language=en_US

    Thanks & Regards,
    _______________________________________________________________

    Vivek Jagad | Team Lead, Technical Support, Global Customer Experience

    Log a Support Case | Sophos Service Guide
    Best Practices – Support Case  | Security Advisories 
    Compare Sophos next-gen Firewall | Fortune Favors the prepared
    Sophos Community | Product Documentation | Sophos Techvids | SMS
    If a post solves your question please use the 'Verify Answer' button.

Reply Children