This discussion has been locked.
You can no longer post new replies to this discussion. If you have a question you can start a new discussion

[Sophos SGG290] CPU 100% and log disk space too

Hello,

Our client is currently experiencing a problem.

His Sophos SG290 has a CPU and log disk problem at 100% continuously.

I have found people who talk about this and how to solve it: https://community.sophos.com/utm-firewall/f/management-networking-logging-and-reporting/33301/asg320-disk-space-full-and-100-cpu-load

i can't find the last one :

/var/storage/pgsql/init/reporting_db_init.sh


And I would like to know how is it possible to know the reason for such a large generation of logs as we had already done the log deletion a short time ago.

Because there is nothing on logs that can explain this (no DDOS...). 

This only solved the problem temporarily.


Here is my open case : 

04327429
Can you help me to find where is the problem ?
Regards.


This thread was automatically locked due to age.
Parents
  • Salut Raphaëlle and welcome to the UTM Community!

    What non-zero file sizes do you see when you enter the following command at the command line?

         ll /var/log/*.log|sort -n

    What processes do you see taking  so much CPU when you run top?

    Pictures or copied lines for both questions, please.

    Cheers - Bob

     
    Sophos UTM Community Moderator
    Sophos Certified Architect - UTM
    Sophos Certified Engineer - XG
    Gold Solution Partner since 2005
    MediaSoft, Inc. USA
  • Hello Bob :) 

    Here is the result of your command :

    customerfw:/var/log # ll /var/log/*.log|sort -n
    -rw-r--r-- 1 root log 0 Aug 27 00:00 /var/log/aptp.log
    -rw-r--r-- 1 root log 0 Aug 27 00:00 /var/log/boot.log
    -rw-r--r-- 1 root log 0 Aug 27 00:00 /var/log/endpoint.log
    -rw-r--r-- 1 root log 0 Aug 27 00:00 /var/log/html5vpn.log
    -rw-r--r-- 1 root log 0 Aug 27 00:00 /var/log/login.log
    -rw-r--r-- 1 root log 0 Aug 27 00:00 /var/log/reverseproxy.log
    -rw-r--r-- 1 root log 1048576 Aug 27 16:37 /var/log/smtp.log
    -rw-r--r-- 1 root log 10771 Aug 27 16:25 /var/log/uma.log
    -rw-r--r-- 1 root log 1077248 Aug 27 16:37 /var/log/mdw-debug.log
    -rw-r--r-- 1 root log 1110016 Aug 27 16:36 /var/log/selfmon.log
    -rw-r--r-- 1 root log 114688 Aug 27 16:37 /var/log/httpd.log
    -rw-r--r-- 1 root log 1253376 Aug 27 16:37 /var/log/named.log
    -rw-r--r-- 1 root log 13856768 Aug 27 16:37 /var/log/packetfilter.log
    -rw-r--r-- 1 root log 13940 Aug 27 16:37 /var/log/logging.log
    -rw-r--r-- 1 root log 1847296 Aug 27 16:37 /var/log/red.log
    -rw-r--r-- 1 root log 192512 Aug 27 16:37 /var/log/afc.log
    -rw-r--r-- 1 root log 196608 Aug 27 16:37 /var/log/rsyncd.log
    -rw-r--r-- 1 root log 2510 Aug 27 16:09 /var/log/wireless.log
    -rw-r--r-- 1 root log 2572288 Aug 27 16:37 /var/log/fallback.log
    -rw-r--r-- 1 root log 258048 Aug 27 16:37 /var/log/mdw.log
    -rw-r--r-- 1 root log 262144 Aug 27 16:37 /var/log/up2date.log
    -rw-r--r-- 1 root log 2804 Aug 27 00:00 /var/log/sshd.log
    -rw-r--r-- 1 root log 2818048 Aug 27 16:37 /var/log/ftp.log
    -rw-r--r-- 1 root log 2977792 Aug 27 16:37 /var/log/confd.log
    -rw-r--r-- 1 root log 299008 Aug 27 16:37 /var/log/kernel.log
    -rw-r--r-- 1 root log 33480704 Aug 27 16:36 /var/log/confd-debug.log
    -rw-r--r-- 1 root log 3461120 Aug 27 16:37 /var/log/high-availability.log
    -rw-r--r-- 1 root log 3670016 Aug 27 16:37 /var/log/system.log
    -rw-r--r-- 1 root log 36864 Aug 27 16:37 /var/log/aua.log
    -rw-r--r-- 1 root log 385024 Aug 27 16:36 /var/log/notifier.log
    -rw-r--r-- 1 root log 43438399488 Aug 27 16:37 /var/log/http.log
    -rw-r--r-- 1 root log 454656 Aug 27 16:37 /var/log/ips.log
    -rw-r--r-- 1 root log 686 Aug 27 06:39 /var/log/mg-agent.log
    -rw-r--r-- 1 root log 712704 Aug 27 16:37 /var/log/webadmin.log
    -rw-r--r-- 1 root log 81920 Aug 27 16:37 /var/log/dhcpd.log
    -rw-r--r-- 1 root log 84365312 Aug 27 16:37 /var/log/openvpn.log

    And the result of top command : 

    top - 16:40:03 up 29 days, 14:33,  1 user,  load average: 4.59, 4.85, 4.88
    Tasks: 181 total,   4 running, 174 sleeping,   0 stopped,   3 zombie
    Cpu(s): 57.1%us, 31.2%sy,  0.0%ni,  2.7%id,  0.0%wa,  0.0%hi,  9.0%si,  0.0%st
    Mem:   8090152k total,  7429644k used,   660508k free,   206912k buffers
    Swap:  4194300k total,   867064k used,  3327236k free,  4273440k cached
    
      PID USER      PR  NI  VIRT  RES  SHR S   %CPU %MEM    TIME+  COMMAND
    30274 httpprox  20   0 1708m 992m 5676 S     72 12.6   7154:16 httpproxy
     5733 root      20   0  702m 587m 2232 R     27  7.4   4475:52 syslog-ng
      846 snort     15  -5  147m 119m 1380 R     23  1.5 822:56.92 snort
     4873 root      15  -5 50664  36m  508 R     17  0.5   2266:36 conntrackd
    10745 root      20   0 31832 1872 1380 S     10  0.0   0:01.39 websec-reporter
    10705 root      19  -1 35720 4644 1236 S      7  0.1   0:01.50 ulogd
    30246 httpprox  20   0  135m 112m  54m S      7  1.4 660:49.04 urid
     4208 root      20   0  280m 238m  804 S      6  3.0 900:30.90 oculusd
    10797 root      20   0     0    0    0 Z      4  0.0   0:00.12 confd.plx <defunct>
     1880 afcd      19  -1 42208  17m 7576 S      3  0.2   0:40.75 afcd
    10780 root      20   0 64160  21m 1656 S      1  0.3   0:00.02 confd.plx
     2299 root      20   0     0    0    0 S      0  0.0   3:24.88 kworker/0:0
     6043 root      20   0 32224 1864 1612 S      0  0.0   0:05.00 vpn-reporter.pl
        1 root      20   0  3976  536  508 S      0  0.0   0:22.06 init

    Thank you for your help.

    Regards,

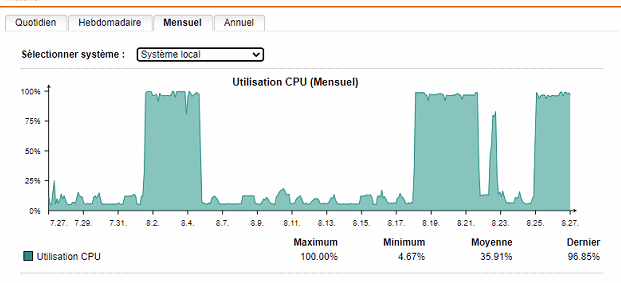
  • I asked the customer why the CPU is not 100% like last time, he told me that the CPU has random spikes. So it is not 100% all the time. Here is a picture of the spikes in question:

  • Merci, Raphaëlle, c'est exactement ce que je voulais voir. ;)

    Something strange is going on with Web Filtering as that log alone was 43 GB at 16:47.  Discovering the problem there may resolve the CPU load issue.  I would start with the following command to see in which month the problem started:

         du -shx /var/log/http/2021/* | sort -rh 

    If that indicates it started in month 06, find the day with:

         ll /var/log/http/2021/06

    Check the 'Management' section in WebAdmin to see what changes might have been made that day.

    Normally, with 100% CPU, I would consider rebuilding the PostgreSQL databases, but I would wait to do that if resolving the httpproxy issue doesn't fix your problem.

    In any case, I would recommend getting Sophos Support involved.

    Cheers - Bob

     
    Sophos UTM Community Moderator
    Sophos Certified Architect - UTM
    Sophos Certified Engineer - XG
    Gold Solution Partner since 2005
    MediaSoft, Inc. USA
  • Hello,

    I apply your command and that is the result : 


    customerfw:/var/log # du -shx /var/log/http/2021/* | sort -rh
    8.0K /var/log/http/2021/08

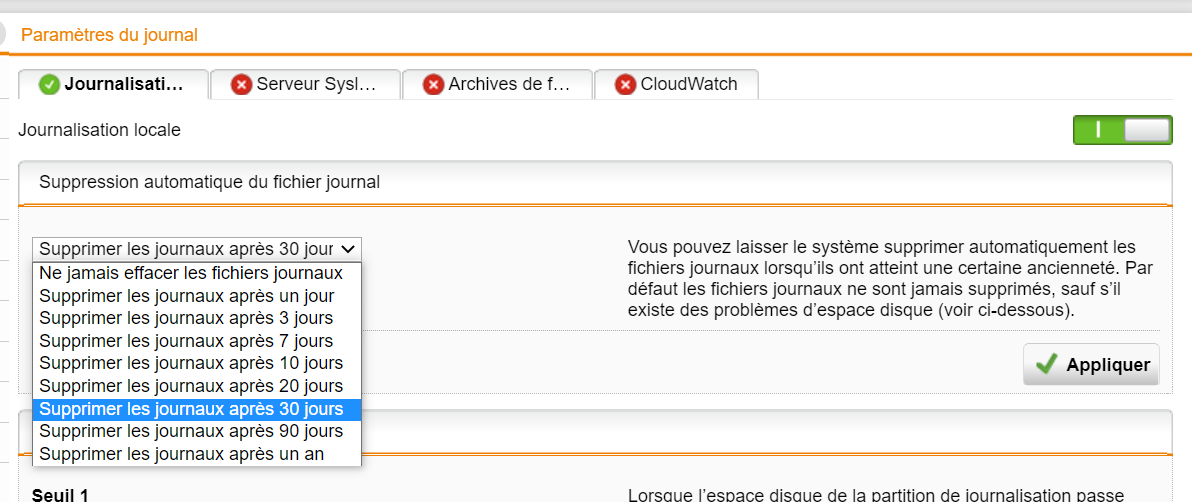
    I think this is because i set up the logs settings on "logs & reports" 3 months to 1 months yesterday.

    I got down to 79% on disk logs. I see that it is not the archives that are taking up space but the actual http.log.

    The problem is that the end customer is asking me to find out why the file started taking up so much space when three quarters of the company was on holiday but I can't find anything significant in http.log :/

    I have another question : if i rebuild postgresql database, i just lost all reports not more ?

    Regards.

  • Salut Raphaëlle,

    Yes, rebuilding the PgSQL databases will erase the history in the graphs and Reporting.

    I would set the Automatic log deletion back to "Never delete" and delete files in /var/log/http/2021/ that are over a few days old.

    I would get Sophos Support involved immediately.  While waiting for them, we can try to understand what's going on with Web Filtering.

    Looking in today's log, copy about 200 lines from an hour before people started working in the morning.  Drag-n-drop that file on a new post here so that I can see what you're seeing.  If you're not comfortable with that, send me a private message with your email and I will email you.

    Cheers - Bob

     
    Sophos UTM Community Moderator
    Sophos Certified Architect - UTM
    Sophos Certified Engineer - XG
    Gold Solution Partner since 2005
    MediaSoft, Inc. USA
  • Thanks for your PM, Raphaëlle.  I don't see any deletion in the history list of commands by root.  You might click on 'Management' in WebAdmin to see what changes were made by SophosUTMSupport.

    Cheers - Bob

     
    Sophos UTM Community Moderator
    Sophos Certified Architect - UTM
    Sophos Certified Engineer - XG
    Gold Solution Partner since 2005
    MediaSoft, Inc. USA
  • In Sophos Management, they do nothing on GUI : 

    Regards.

  • Strange that the problem disappeared without any modifications that we could see!

    Cheers - Bob

     
    Sophos UTM Community Moderator
    Sophos Certified Architect - UTM
    Sophos Certified Engineer - XG
    Gold Solution Partner since 2005
    MediaSoft, Inc. USA
Reply Children
No Data