This discussion has been locked.
You can no longer post new replies to this discussion. If you have a question you can start a new discussion

High CPU usage since 2:20 this night

Hello,

I already contacted Sophos Support and now I am waiting for the callback from the senior engineers.

However, I also don't find it wrong to ask here.

I am having 100% usage if I enable the internet connection. We are using a LTE modem (modem, not router). While the connection is started, the whole GUI is extremely laggy, takes sometimes 1-2 Minutes to switch between pages. And basically only disabling the WAN interface and the webadmin interface is almost instantly responsive. 100% CPU usage remains a while, and it also goes down by itself after a while.

Now, I called my ISP, and asked them if there are some issues known, and they told me they "see something, but can't tell me exactly what". And told me basically to wait till tomorrow and see if it's better.

I am also ruling out a firewall overload. We have around 10-15 SSL remote access users, a site to site and RED. Firewall usage is usually between 30-50%. Logs reflect that too.

Sophos Support said it might be that, but it also might be hardware. Even maybe something else. They are now consulting with senior engineers.

Is there something I can do on the firewall to ascertain the cause of the issue?

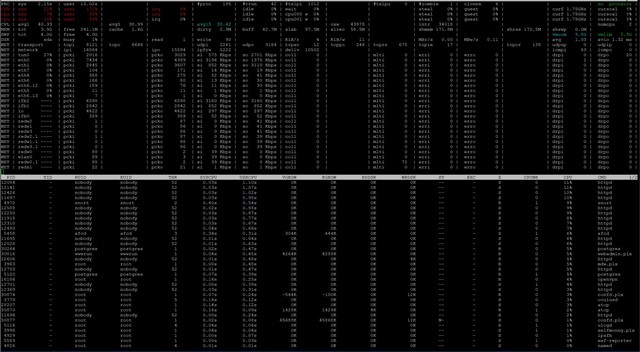
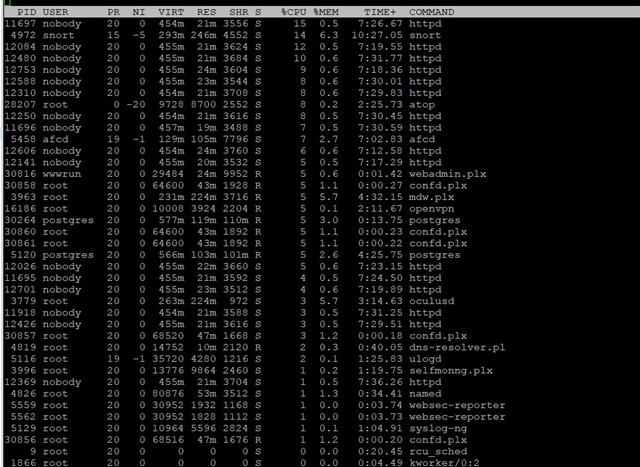
I already checked top and atop, and there are only weird entries like USER "nobody" and command "HTTPD". Those take 10% and more, and there are more than one. Here are screenshots of those.

Can you make something of this?

Thank you


This thread was automatically locked due to age.
Parents
  • I am further troubleshooting this, I found out that it's actually our monitoring software that we use with some of our clients (N-Central). There was an update on 27.04., which corresponds with the fact that the connections were rising consequently for about 6 hours. I am guessing that either Solarwinds or our Server was pushing the Agent-Update to the clients.

    Apparently WAF wasn't able to handle the load. So I deleted all profiles there and moved to port forwarding, however it doesn't work with that and I also have no idea why.

    I am however troubleshooting the thing, and I am having a real hard time with the Sophos SG125, since it really can't handle many concurrent connections well. When it the area of 1000, it's fine, but if it climbs to 13,000, the whole firewall starts to be very laggy. It also happens if I drop all the packets.

    I tried setting a Drop rule for our N-Central port (Any->NC-Port->Any), without logging, in hope to clean up the live view, but not possible. As soon as I open the live view, everything stops reacting. The only chance I have is to close everything and log into the webadmin again.

    What would however help with some troubleshooting is if I could see, live, how many concurrent connections there are.

    There is a view under interfaces and hardware in logs, but that is hardly live. I have to wait for a while to see the log "move", to see if something changed.

    Neither atop, top or iftop show me number of current concurrent connections.

    Is there a way?

Reply
  • I am further troubleshooting this, I found out that it's actually our monitoring software that we use with some of our clients (N-Central). There was an update on 27.04., which corresponds with the fact that the connections were rising consequently for about 6 hours. I am guessing that either Solarwinds or our Server was pushing the Agent-Update to the clients.

    Apparently WAF wasn't able to handle the load. So I deleted all profiles there and moved to port forwarding, however it doesn't work with that and I also have no idea why.

    I am however troubleshooting the thing, and I am having a real hard time with the Sophos SG125, since it really can't handle many concurrent connections well. When it the area of 1000, it's fine, but if it climbs to 13,000, the whole firewall starts to be very laggy. It also happens if I drop all the packets.

    I tried setting a Drop rule for our N-Central port (Any->NC-Port->Any), without logging, in hope to clean up the live view, but not possible. As soon as I open the live view, everything stops reacting. The only chance I have is to close everything and log into the webadmin again.

    What would however help with some troubleshooting is if I could see, live, how many concurrent connections there are.

    There is a view under interfaces and hardware in logs, but that is hardly live. I have to wait for a while to see the log "move", to see if something changed.

    Neither atop, top or iftop show me number of current concurrent connections.

    Is there a way?

Children
No Data