This discussion has been locked.
You can no longer post new replies to this discussion. If you have a question you can start a new discussion

High CPU usage since 2:20 this night

Hello,

I already contacted Sophos Support and now I am waiting for the callback from the senior engineers.

However, I also don't find it wrong to ask here.

I am having 100% usage if I enable the internet connection. We are using a LTE modem (modem, not router). While the connection is started, the whole GUI is extremely laggy, takes sometimes 1-2 Minutes to switch between pages. And basically only disabling the WAN interface and the webadmin interface is almost instantly responsive. 100% CPU usage remains a while, and it also goes down by itself after a while.

Now, I called my ISP, and asked them if there are some issues known, and they told me they "see something, but can't tell me exactly what". And told me basically to wait till tomorrow and see if it's better.

I am also ruling out a firewall overload. We have around 10-15 SSL remote access users, a site to site and RED. Firewall usage is usually between 30-50%. Logs reflect that too.

Sophos Support said it might be that, but it also might be hardware. Even maybe something else. They are now consulting with senior engineers.

Is there something I can do on the firewall to ascertain the cause of the issue?

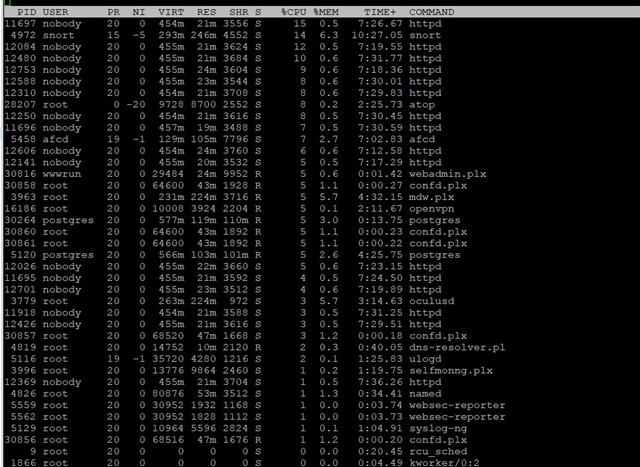
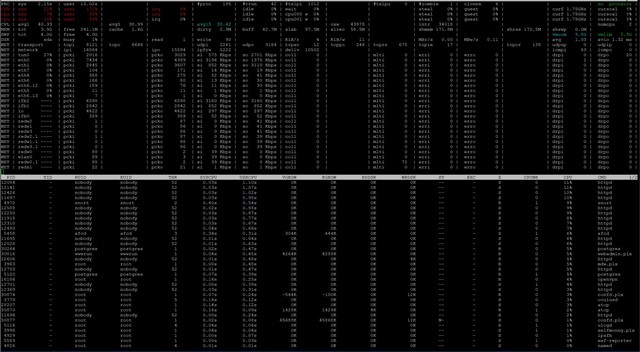
I already checked top and atop, and there are only weird entries like USER "nobody" and command "HTTPD". Those take 10% and more, and there are more than one. Here are screenshots of those.

Can you make something of this?

Thank you


This thread was automatically locked due to age.
  • I already checked top and atop, and there are only weird entries like USER "nobody"

    I wouldn't worry about this user, that is a common special group for security in Linux.  As far as your other issues, I don't know, as I am not that versed in the advanced side of things in UTM.  I know we had a post about something similar to his a month or two ago here that I am trying to find and link in case it had any results.  There were several people that posted that had this happen all around the same date/time.

    I saw my UTM do this in my own home environment because of a bad MiniGBIC port on a switch that was connected back to my core switch.  For whatever the reason when I rebooted the switches, that connectivity would cause my UTM to spin up something crazy, and you could hear all of my fans in the UTM kicking up.  Disconnecting that GBIC brought it back down, so I replaced the switch and haven't had a problem since then.

    Edit:  This is the post I was thinking of, but may not be your issue.  I don't see rrdtool on your screenshots:  rrdtool high cpu usage - General Discussion - UTM Firewall - Sophos Community

    OPNSense 64-bit | Intel Xeon 4-core v3 1225 3.20Ghz
    16GB Memory | 500GB SSD HDD | ATT Fiber 1GB
    (Former Sophos UTM Veteran, Former XG Rookie)

  • Thank you. My problem is httpd apparently. Multiple instances which consume lot of CPU. That is also visible in ps aux.

    And that only when I connect our LTE. Doesn't happen with our 2nd ISP connection, which is DSL (both are static IP LAN connections).

  • It was terrible to troubleshoot since the firewall was so unresponsive, but I finally managed to spot the cause:

    It apparently is N-Central that we use for management of some of our customers. We have it running over the custom port (call it xxxx).

    Currently it is configured via WAF, since I am using a LE certificate there. As soon as I enable the virtual server for the port where agents are, things start to go south.

    It also explains why it looked like it was a LTE connection, because duh, NC is going over that LTE link. So are many other things.

    I spotted in Interfaces & Routing, as I've seen a concurrent connections today, rising from about 21:50 yesterday evening, nominal being about 800 connections to 9800 at the peak.

    Now, the weird thing is, it doesn't matter if NC is running or not, as soon as I enable the WAF entry, the firewall CPU goes up and it starts being sluggish. It is also by far the highest traffic in last 1 day, and with highest number of packets, oh some 28 million of them.

    This does sound very suspicious to me.

    I currently stopped NC and WAF completely until I can ascertain what is really going on. I can enable it to test, but I am reluctant at what to do next.

    First and foremost, I'd like to be able to surely ascertain whether this is some kind of system error, on Solarwinds / N-Central side, or did we get hacked?

    I see it according to graph that the connection count started going up at about 22:15 yesterday evening.

    So, I looked under Network Usage. Top clients by service, port reported above as 28 mil.

    I am seeing some differences. While my internal servers, which are also monitored internally, had for instance about 500-5000 connections daily. However, yesterday and today, those numbers climbed. I see a consistent number of computers connecting, mostly 65-70. All connections are according to Sophos from Austria, so I am seeing this as a positive sign.

    Nevertheless, the number of connections per client (agent) has climbed a LOT. From usual 500-2000, to 5000-17000 per client, a total of 2,6 mil according to this list.

    So apparently "Conn" ist not the same as "Packet". But comparatively, the received packets are 10x more.

    So I on the right path when it comes to troubleshooting? As far as I can see, Port xxxx is only being accessed by austrian IPs and internal clients. If I open the firewall, the page is barely able to keep responsive due to massive number of packets on the xxxx, now being blocked, since I turned off the WAF.

  • My next question was if you were using WAF, because of HTTPD items you see in your screenshots.  Have you checked the logs for WAF?  Can you post a snippet of them here?  That's a lot of connections, but I don't believe its necessarily hacking going on.  It could be some type of attack on that port (hopefully you aren't using a common port that is notorious for vulnerabilities).  

    OPNSense 64-bit | Intel Xeon 4-core v3 1225 3.20Ghz
    16GB Memory | 500GB SSD HDD | ATT Fiber 1GB
    (Former Sophos UTM Veteran, Former XG Rookie)

  • I actually tried checking the WAF logs. All WAF virtual servers are currently offline.

    Today's WAF log is 75MB! Not sure which part you would want me to post or what I would be looking for in there.

    I am testing right now only port forwarding, without WAF. I can use PF for that port, since it doesn't necessarily require certificate.

    No, NC agents are default at port 443, I changed that to my own port. However, some things remain at 443.

  • Small update: instead using WAF, I set port forwarding only for that agent port now, and the firewall is OK now. I see high number of connections still, but the firewall isn't peaking.

    I still don't understand though why I suddenly have such high number. I opened an emergency ticket with N-Able.

  • I am further troubleshooting this, I found out that it's actually our monitoring software that we use with some of our clients (N-Central). There was an update on 27.04., which corresponds with the fact that the connections were rising consequently for about 6 hours. I am guessing that either Solarwinds or our Server was pushing the Agent-Update to the clients.

    Apparently WAF wasn't able to handle the load. So I deleted all profiles there and moved to port forwarding, however it doesn't work with that and I also have no idea why.

    I am however troubleshooting the thing, and I am having a real hard time with the Sophos SG125, since it really can't handle many concurrent connections well. When it the area of 1000, it's fine, but if it climbs to 13,000, the whole firewall starts to be very laggy. It also happens if I drop all the packets.

    I tried setting a Drop rule for our N-Central port (Any->NC-Port->Any), without logging, in hope to clean up the live view, but not possible. As soon as I open the live view, everything stops reacting. The only chance I have is to close everything and log into the webadmin again.

    What would however help with some troubleshooting is if I could see, live, how many concurrent connections there are.

    There is a view under interfaces and hardware in logs, but that is hardly live. I have to wait for a while to see the log "move", to see if something changed.

    Neither atop, top or iftop show me number of current concurrent connections.

    Is there a way?