This discussion has been locked.
You can no longer post new replies to this discussion. If you have a question you can start a new discussion

UTM 9.4 Home Edition - High CPU load

Hello together,

since upgrading my virtual UTM Home Edition system to 9.4 I notice a high CPU load. With 9.3 the CPU load was at an average of 6 %. Now it's near to 100 %.

This is an actual TOP:

top - 08:53:39 up 1 day, 18:07,  1 user,  load average: 20.05, 13.08, 10.44
Tasks: 175 total,   1 running, 172 sleeping,   0 stopped,   2 zombie
Cpu0  : 53.1%us, 46.5%sy,  0.0%ni,  0.3%id,  0.0%wa,  0.0%hi,  0.0%si,  0.0%st
Cpu1  : 53.1%us, 46.9%sy,  0.0%ni,  0.0%id,  0.0%wa,  0.0%hi,  0.0%si,  0.0%st
Mem:   4055352k total,  3790508k used,   264844k free,   174556k buffers
Swap:  6291448k total,   292020k used,  5999428k free,  1330088k cached

  PID USER      PR  NI  VIRT  RES  SHR S   %CPU %MEM    TIME+  COMMAND
 6163 httpprox  20   0 1412m 1.1g  17m S    194 27.3   4236:40 /var/chroot-http/
 5943 root      20   0 65808  26m 4496 S      3  0.7  23:39.25 /usr/sbin/acc-age
 5479 root      20   0 22168 3296 1764 S      1  0.1  36:34.08 ./ctipd.bin -l /u
 3467 root      20   0  5328 1900 1656 S      0  0.0   1:40.19 /usr/bin/vmtoolsd
 3557 root      20   0  8976 3160 1708 S      0  0.1   0:25.12 /usr/local/bin/sy
 4819 root      20   0 10408 5652 2172 S      0  0.1   1:56.12 /usr/sbin/syslog-
 5510 httpprox  20   0  130m 106m  51m S      0  2.7   1:33.99 /var/chroot-http/
    1 root      20   0  1932  528  504 S      0  0.0   0:02.00 init [3]
    2 root      20   0     0    0    0 S      0  0.0   0:00.02 [kthreadd]
    3 root      20   0     0    0    0 S      0  0.0   0:15.32 [ksoftirqd/0]
    5 root       0 -20     0    0    0 S      0  0.0   0:00.00 [kworker/0:0H]
    7 root      RT   0     0    0    0 S      0  0.0   0:00.82 [migration/0]
    8 root      20   0     0    0    0 S      0  0.0   0:02.25 [rcu_bh]
    9 root      20   0     0    0    0 S      0  0.0   0:55.43 [rcu_sched]
   10 root      RT   0     0    0    0 S      0  0.0   0:00.74 [migration/1]
   11 root      20   0     0    0    0 S      0  0.0   0:06.11 [ksoftirqd/1]

Everything seems to run fine, but the ESXi host is under high CPU pressure and my other running VMs are sometimes a bit slow.

Does anyone else have the same experience with UTM 9.4?

Thank you.


This thread was automatically locked due to age.
Parents
  • Hi TheExpert,

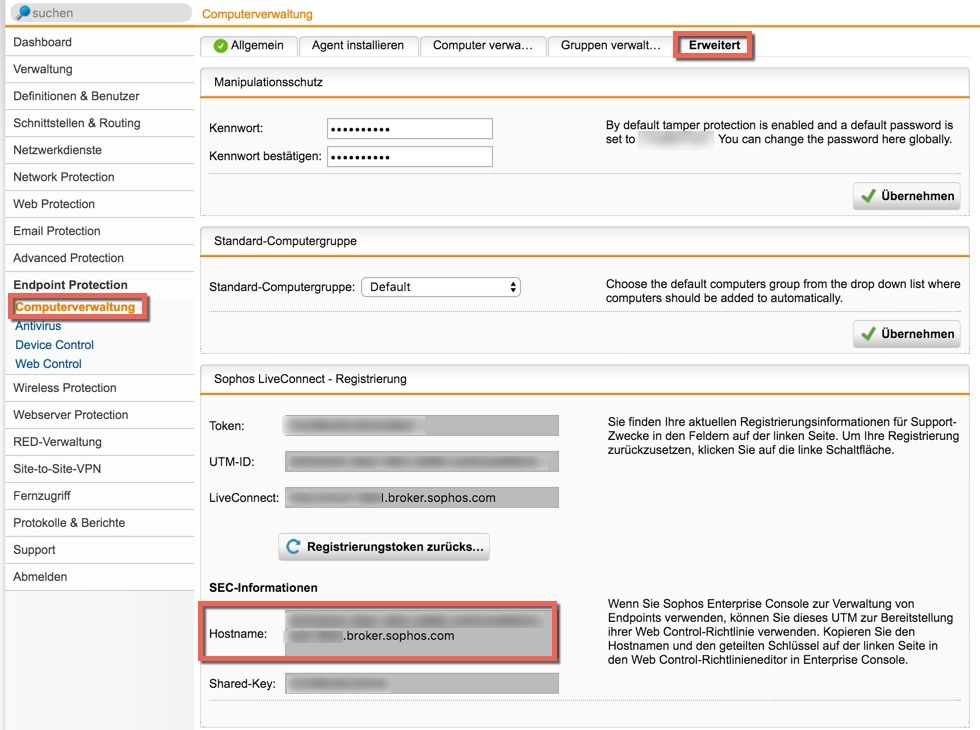
    this is an Bug, relatd by defective broker Servers from sophos. The Endpoints bihind your sophos will connect to the broker hosts, when you have webprotection from the endpoints controlled by the UTM directly or via Sophos Enterprise Console.

    When you show into your proxy log, you will find massive connections to http://hostnameofyourutminendpontprotectionadvancedtab.broker.sophos.com/ with an 500 or 503 error.

    This connections bring your http proxy to 100% CPU load. 

    Sophos is troubleshooting this bug at the moment, but it is not fixed yet.

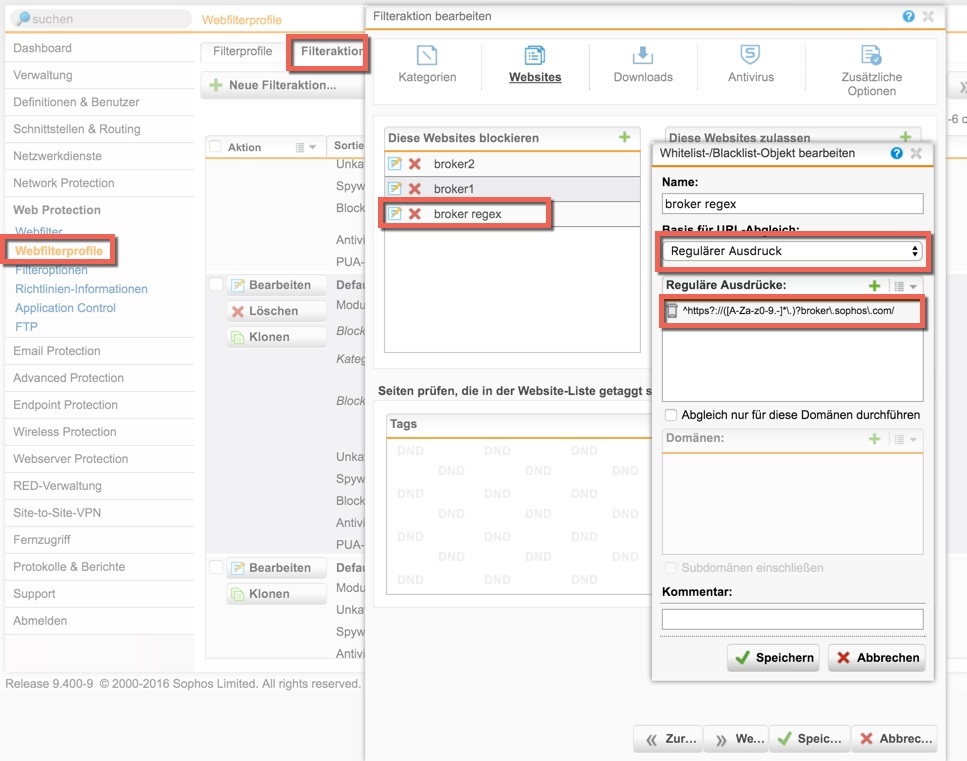
    You can block the broker server traffic at the affected filter action in your webprotection like this:

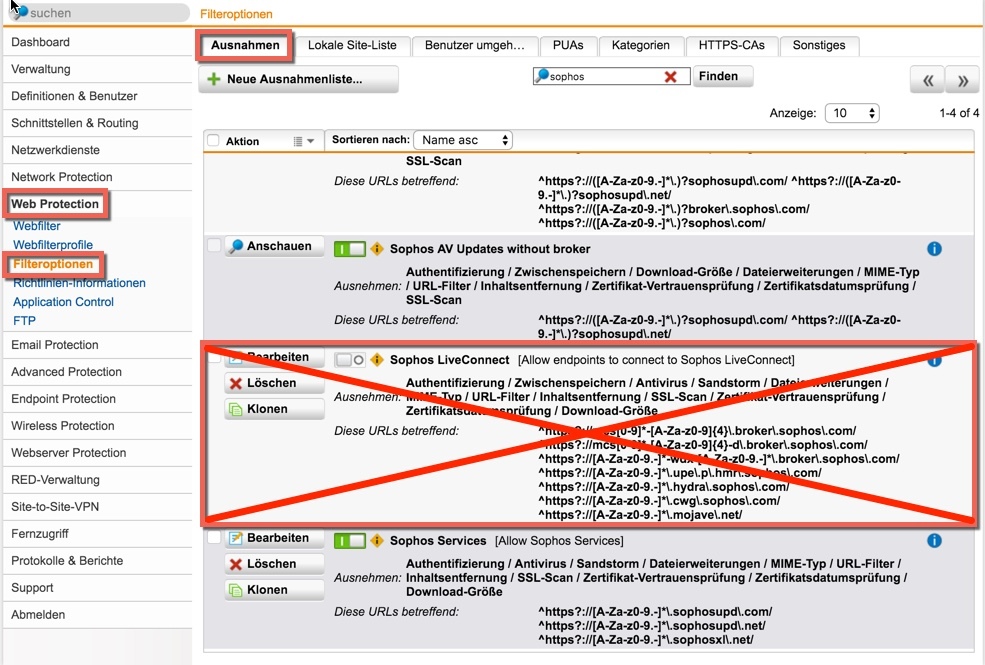
    Disable Filter Action exceptions with the broker regex!!

    This will bring your UTM back to normal CPU usage Level.

    Setting an transparent proxy exception for the UTM Broker Hostname does not help, the Proxy is ignoring this exception. :(

    I have found this bug and can reproduce this on any UTM with 9.4-009 and Endpoints behind the UTM communicates with an broker server, that distributes defective data (HTTP 500 / 503 error). 

    A Bugfix is not available, but this workaround should help.

    Cheers Andreas


    UTM SCE/SCA | Endpoint SCE

  • Thanks a lot for your help.

    this bug also affects Sophos UTM 9.401-11

Reply Children
No Data