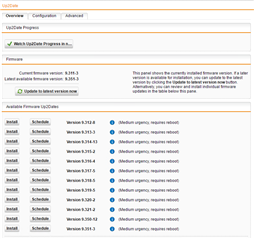
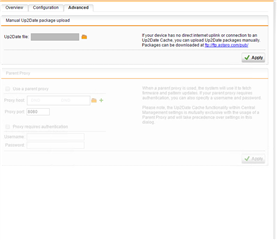
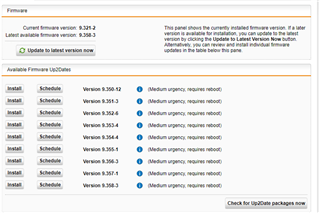
As i have updated two sophos SG450 in the cluster setup manually uploaded update files then update to latest version successfully. But there is also one more setup of two sophos SG450 in the cluster setup active/ready mode, but this time i am facing problem i already uploaded update files not all one time then after that clicked on update to latest version on the GUI.
Once i click on the "watch up2date progress" button it pops-up window but this time its complete white board, nothing any message appears, but after many hours still up2date in progress again click on "watch up2date Progress" nothing appears same white screen i think after 5 hours but i already did one same model same configuration its updated without long time. Then i went to "Logging & Reporting" to see why still updating in progress > view Log Files then go to Log name- Up2date messages log then found some following error:
2018:04:13-15:07:11 dbr-od7-b-dmo-fw-1 audld[12470]: 3. Modules::Audld::Authentication::start:66() /</sbin/audld.plx>Modules/Audld/Authentication.pm
2018:04:13-15:07:11 dbr-od7-b-dmo-fw-1 audld[12470]: 4. main::main:174() audld.pl
2018:04:13-15:07:11 dbr-od7-b-dmo-fw-1 audld[12470]: 5. main::top-level:40() audld.pl
2018:04:13-15:07:11 dbr-od7-b-dmo-fw-1 audld[12470]: |=========================================================================
2018:04:13-15:07:11 dbr-od7-b-dmo-fw-1 audld[12470]: id="3703" severity="error" sys="system" sub="up2date" name="Authentication failed, no valid answer from Authentication Servers"
2018:04:13-15:07:11 dbr-od7-b-dmo-fw-1 audld[12470]:
2018:04:13-15:07:11 dbr-od7-b-dmo-fw-1 audld[12470]: 1. Modules::Logging::alf:100() /</sbin/audld.plx>Modules/Logging.pm
2018:04:13-15:07:11 dbr-od7-b-dmo-fw-1 audld[12470]: 2. Modules::Audld::Authentication::start:70() /</sbin/audld.plx>Modules/Audld/Authentication.pm
2018:04:13-15:07:11 dbr-od7-b-dmo-fw-1 audld[12470]: 3. main::main:174() audld.pl
2018:04:13-15:07:11 dbr-od7-b-dmo-fw-1 audld[12470]: 4. main::top-level:40() audld.pl
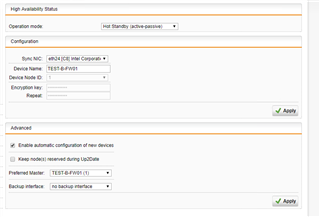
But i don't know which Authentication is failed. I go to "Management > High Availability" and see HA mode one master is Active and Slave is UP2date status. It means up2date in progress. Even i tried to reboot both the nodes one by one but still the same status.
Please also find HA live log:
Live Log: High availability
Filter:
Autoscroll
Reload
2018:04:13-14:40:19 dbr-od7-b-dmo-fw-1 ha_daemon[4608]: id="38A3" severity="debug" sys="System" sub="ha" seq="M: 49 19.573" name="Netlink: Found link beat on eth3 again!"
2018:04:13-14:40:19 dbr-od7-b-dmo-fw-1 ha_daemon[4608]: id="38A3" severity="debug" sys="System" sub="ha" seq="M: 50 19.573" name="Netlink: Lost link beat on eth5!"
2018:04:13-14:40:19 dbr-od7-b-dmo-fw-1 ha_daemon[4608]: id="38A3" severity="debug" sys="System" sub="ha" seq="M: 51 19.573" name="Netlink: Lost link beat on eth6!"
2018:04:13-14:40:19 dbr-od7-b-dmo-fw-1 ha_daemon[4608]: id="38A3" severity="debug" sys="System" sub="ha" seq="M: 52 19.573" name="Netlink: Found link beat on eth18 again!"
2018:04:13-14:40:19 dbr-od7-b-dmo-fw-1 ha_daemon[4608]: id="38A3" severity="debug" sys="System" sub="ha" seq="M: 53 19.574" name="Netlink: Found link beat on eth4 again!"
2018:04:13-14:40:19 dbr-od7-b-dmo-fw-1 ha_daemon[4608]: id="38A3" severity="debug" sys="System" sub="ha" seq="M: 54 19.574" name="Netlink: Found link beat on eth1 again!"
2018:04:13-14:40:19 dbr-od7-b-dmo-fw-1 ha_daemon[4608]: id="38A3" severity="debug" sys="System" sub="ha" seq="M: 55 19.574" name="Netlink: Found link beat on eth2 again!"
2018:04:13-14:40:19 dbr-od7-b-dmo-fw-1 ha_daemon[4608]: id="38A3" severity="debug" sys="System" sub="ha" seq="M: 56 19.574" name="Netlink: Found link beat on eth5 again!"
2018:04:13-14:40:19 dbr-od7-b-dmo-fw-1 ha_daemon[4608]: id="38A3" severity="debug" sys="System" sub="ha" seq="M: 57 19.574" name="Netlink: Found link beat on eth6 again!"
2018:04:13-14:41:01 dbr-od7-b-dmo-fw-1 ha_daemon[4608]: id="38A0" severity="info" sys="System" sub="ha" seq="M: 58 01.790" name="Monitoring interfaces for link beat: lag3 lag1 lag2 lag0"
System live message log:
Live Log: System messages
Filter:
Autoscroll
Reload
2018:04:13-15:23:54 dbr-od7-b-dmo-fw-2 snmpd[31735]: Wrong netlink message type 3
2018:04:13-15:24:01 dbr-od7-b-dmo-fw-1 snmpd[5756]: Wrong netlink message type 3
2018:04:13-15:24:49 dbr-od7-b-dmo-fw-1 dns-resolver[5708]: DNS server failed to contact!
2018:04:13-15:24:54 dbr-od7-b-dmo-fw-2 snmpd[31735]: Wrong netlink message type 3
2018:04:13-15:25:01 dbr-od7-b-dmo-fw-2 /usr/sbin/cron[19110]: (root) CMD ( /usr/local/bin/reporter/system-reporter.pl)
2018:04:13-15:25:01 dbr-od7-b-dmo-fw-1 snmpd[5756]: Wrong netlink message type 3
2018:04:13-15:25:01 dbr-od7-b-dmo-fw-1 /usr/sbin/cron[17151]: (root) CMD ( /usr/local/bin/reporter/system-reporter.pl)
2018:04:13-15:25:54 dbr-od7-b-dmo-fw-2 snmpd[31735]: Wrong netlink message type 3
2018:04:13-15:26:01 dbr-od7-b-dmo-fw-1 snmpd[5756]: Wrong netlink message type 3
2018:04:13-15:26:19 dbr-od7-b-dmo-fw-1 dns-resolver[5708]: DNS server failed to contact!
2018:04:13-15:26:54 dbr-od7-b-dmo-fw-2 snmpd[31735]: Wrong netlink message type 3
Even i ssh logged in then go to /var/up2date/sys-install and seen uploaded files when type df -h then also file space is available more than 1.5 GB. ha_utils ssh to login both nodes worked well.
Please help me out guys!
Thanks and Regards
Syed
This thread was automatically locked due to age.


