This discussion has been locked.
You can no longer post new replies to this discussion. If you have a question you can start a new discussion

High httpproxy memory usage with 9.713 and 9.714

Hello,

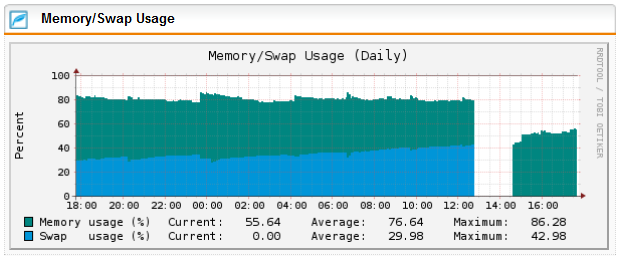
I have a pair of virtual UTMs which have run for years with about 4G of RAM allocated to them. After the upgrade from 9.712 to 9.713 in Nov I noticed my swap usage climbing beyond its normal 10-15% level. The culprit was the httpproxy proces so I added about 1/2G to the VMs which returned the swap usage to about 15%. This past week I updated to 9.714 and observed the httpproxy process growing much larger driving swap usage into the 60% range.

The two systems run with almost identical configurations which change very little over time. Our usage patterns have not changed much either. I have not noticed anything in the release notes suggesting a significant change that should require more memory, so my suspicion at this point is that the httpproxy process has a memory leak.

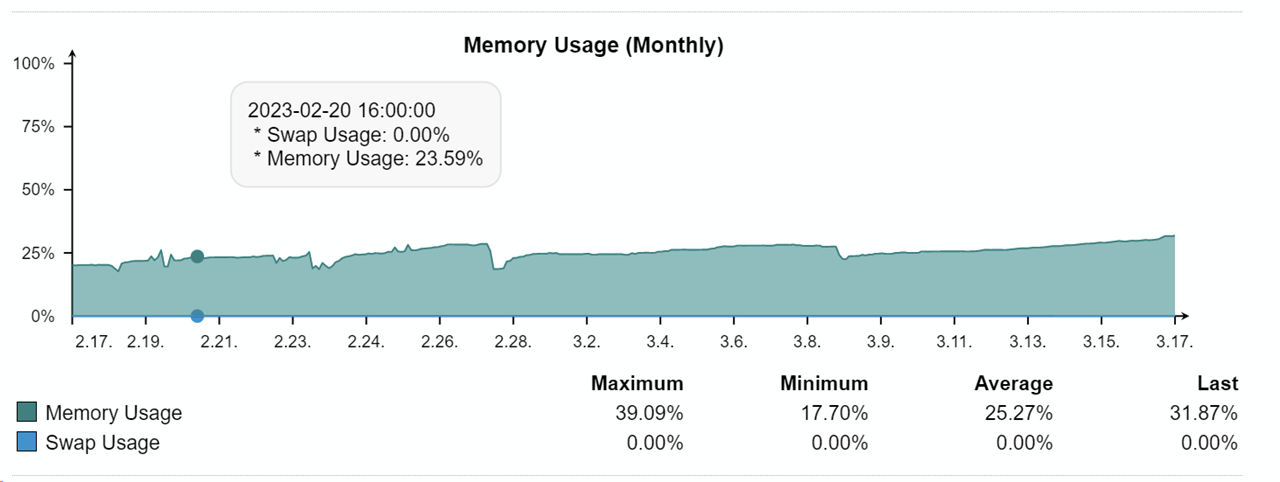
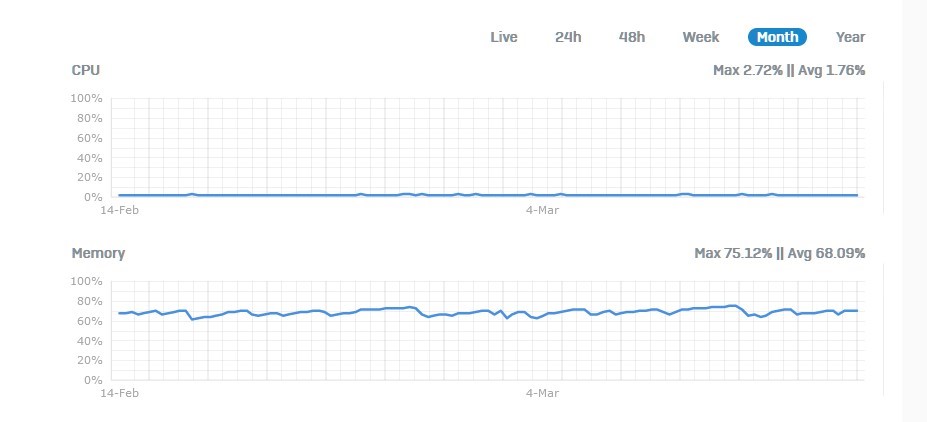
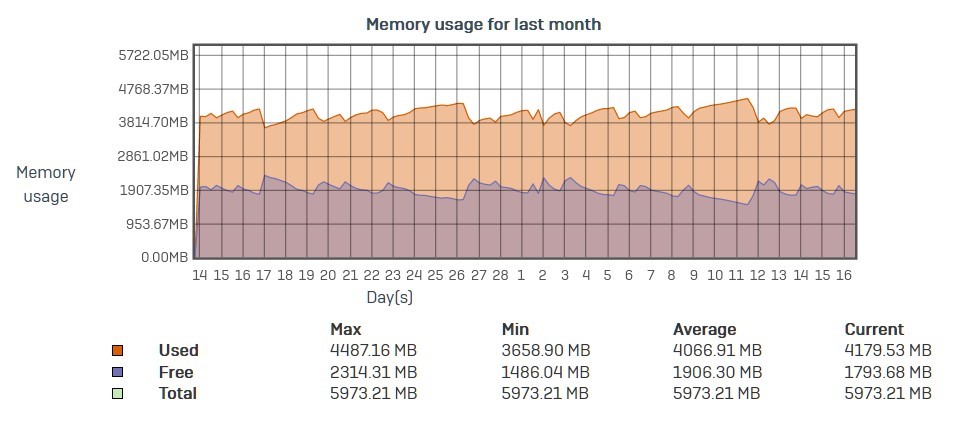
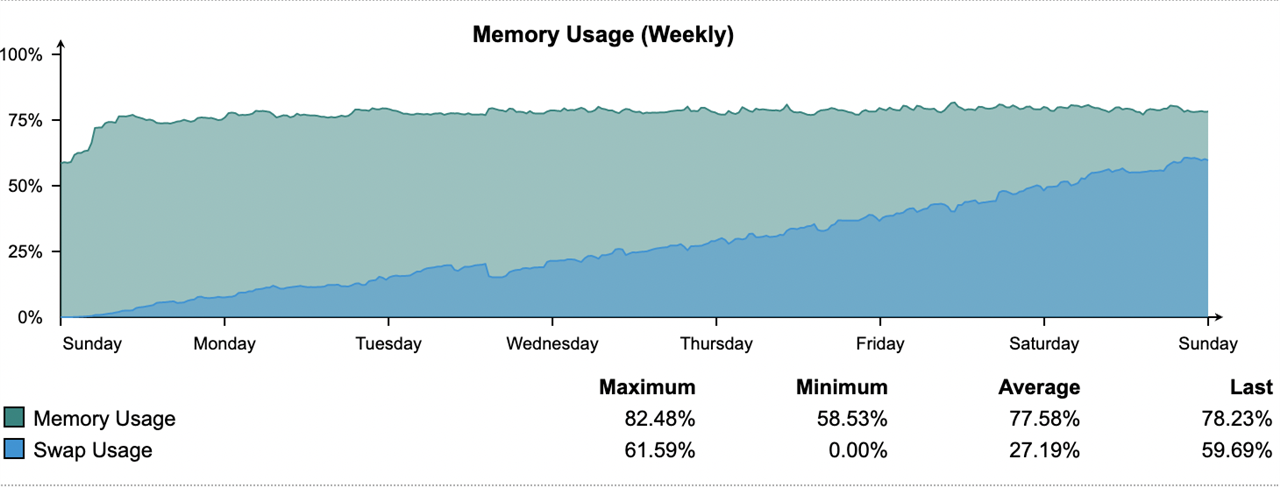
The graph below shows 9.714 after a restart last week. Here is the current httpproxy memory/swap usage:

  PID USER      PR  NI  VIRT  RES  SHR S   %CPU %MEM    TIME+  SWAP COMMAND                                                                                                      
 4776 httpprox  20   0 6202m 1.6g 3996 S      1 38.4  46:09.01 4.4g httpproxy
                                                                                                     

--Larry


This thread was automatically locked due to age.
  • The continual increase in reported swap usage is an expected behaviour on Linux systems.

    Swap usage is triggered as the required amount of system memory exceeds the amount of available RAM. The switch to 64-bit operation for various components, including the scan engines, in 9.713 had an impact in the amount of RAM used by those components - some data that would have used 32 bits to store now would take 64 bits. This has unavoidably increased the amount of RAM required to run UTM. So devices that previously managed to sit within the available physical RAM may now find they have to use swap space from time to time.

    The way that the kernel consumes swap and reports on available/used space is a bit misleading here. Unlike the RAM statistic, the used swap will almost never go down. Whenever new swap space is required, the system does the 'lazy' thing and just consumes a little more of the swap partition, instead of cleaning up and reusing old space. Even if the system only needs 1Mb of swap once an hour while a reporting job runs, the used swap may go up by 1Mb every hour. Once all the unused swap space is consumed, it will start to re-use expired swap space.

    Obviously, the swap usage will go back down again when you reboot the device.

    As long as the available memory is not pegged at 100% as well, this swap increase is nothing to be concerned about and certainly on its own does not indicate a memory leak.

  • And pretty much the very reason XG is a memory hog.  I personally believe that XG's limited memory as it is now is a hindrance and I wish Sophos would rethink that model.

    With hardly anything configured, I sit between 65%-71% memory usage on the same machine I was running UTM on just a few days ago. I get sticker shock looking at my graphs on XG, hah.

    OPNSense 64-bit | Intel Xeon 4-core v3 1225 3.20Ghz
    16GB Memory | 500GB SSD HDD | ATT Fiber 1GB
    (Former Sophos UTM Veteran, Former XG Rookie)

  • The "SWAP" column in top is pretty meaningless. It is actually just the difference between (total memory space requested) and (total physical memory in use) for the process, but it does not actually tell you how much of that memory is, or has ever been, in use, even less how much actual swap space is taken up or how much swap activity is being caused.

    It's quite possible for a program to tell the operating system it needs 2.1Gb of RAM, but for it to never use most of it. The operating system will only allocate real memory (RAM or swap) when it's used, not when it's mapped or allocated. That's why, on your system with 16Gb of physical RAM, it has never actually had to consume any SWAP space.

    The answer to this question on Server Fault explains this more completely. You can see this most clearly by looking at the last two lines of the top output:

    • httpd - VIRT=450m, RES=19m, so SWAP=450m-19m= (approx) 430m
    • httpproxy - VIRT=1526m, RES=1.2g, so SWAP= 1526m-1.2g=(approx) 334m

    Where

    • VIRT is 'virtual memory space size' or in other words 'how much memory has the program asked for'
    • RES is 'resident memory consumption for this process alone' or 'how much actual space is this process really using right now'
    • SHR is 'memory in use that is or could be shared with other processes' or 'how much space is this process using that's also common to another process'
  • I had the same problem on our SG115 UTM wiht 4GB Memory inside. After a reboot it takes a longe time, 10-20 day to get the swap to 70%,
    really bad for the machine performance and the SSD.

    I exchanged the SODIMM to a 8GB Module today and everything is fine.

    And more, before and long time before also alway some level of swapping happend. 10-20%. Now, no swapping. So i can strongly recommand to upgrade to 8GB

  • That's some crazy swap usage.  I tried 8GB too, but was seeing small amounts of swap usage after a week or so. Bumping it up to 16GB eliminated that entirely.

    It's interesting how it slowly ramps up.  I think the http proxy has a memory leak of some sort.  If I stop the proxy and restart, it will reset the ramp.

    Edit: Killing the web filtering drops the ram usage from 32% to 15%!  The filtering is just url, no caching or anything.

  • Yep, I noticed that as well. It looks like a memory leak & thus part of why I started this thread.

    In my case, adding memory isn't really a good option, so I've added the following work-around to restart the process once it grows past 3GB:

    Add to /etc/crontab-static:

    # Kill httpproxy when it grows too large

    03 * * * * root mem=`ps ax -o vsz,cmd|grep -v grep|grep httpproxy|awk '{print $1}'`;if [[ $mem -ge $((3*1024*1024)) ]];then kill `ps ax -o pid,cmd|grep -v grep|grep httpproxy|awk '{print $1}'`; fi

    The process is restarted once the system notices that it's missing, which happens fairly quickly.

    To get the changes added to the running crontab, make a change in the UI. For example, Management / Up2Date / Configuration / Pattern download interval

    --Larry

  • Here is a comparison with XG.  Keep in mind, the hardware limitation, even though I have 16GB of memory, I can only use 6GB.  Memory usage should be increased for home use license for XG, IMO.  CPU I think is fine, but this is scary usage.

    OPNSense 64-bit | Intel Xeon 4-core v3 1225 3.20Ghz
    16GB Memory | 500GB SSD HDD | ATT Fiber 1GB
    (Former Sophos UTM Veteran, Former XG Rookie)

  • Yes, maybe its a memory leak. I installed now, after the 8GB the 9.715-3 update. I will wait for some weeks now and report how it goes with memory and swap usage

  • What happens if the proxy is restarted during the day, in the middle of someone trying to browse somewhere?

    I think it would be more useful as a nightly event (ie, run at 0600 or something when there's no usage)?

  • I thought about that as well, however I've had this in place for several weeks now & so far it has not been a problem. The process is restarted within a minute based upon the notifications I've received. If we do start to have timeouts and connection failures then I'll adjust the crontab.

    --Larry