This discussion has been locked.
You can no longer post new replies to this discussion. If you have a question you can start a new discussion

HA UNLINKED on Sophos UTM after nothing

Hello,

First of all, i wish you a Happy new year !

I'm writing to you because our customer has a Sophos UTM firewall in version 9.7 for almost 2 years.

Our customer claims to have tested the Slave firewall in the meantime and it was working fine.

However, today and for some time the HA SLAVE firewall remains in "UNLINKED" status. I am unable to determine how long it has been like this as the logs are limited to 30 days due to another log storage problem that was full (We did something about this firewall 3 months ago when we tried to rebuild the DB is maybe related?).

In any case, the MASTER and SLAVE firewalls have already been restarted several times.
Here are the references I can give you:
- Firmware of both UTMs: 9.707-5
- Last big update: more than 1.5 years ago

Here are the actions that have been taken:
- Restart of the two firewalls -> NOK
- Checked the cabling -> They have not touched anything for a long time
- Verification of the HA link, it goes up physically in the CLI (ETH3)

customername:/home/login # ip link show
5: eth3: <BROADCAST,MULTICAST,UP,LOWER_UP> mtu 2000 qdisc mq state UP mode DEFAULT group default qlen 1000
link/ether 7c:5a:1c:48:cb:53 brd ff:ff:ff:ff:ff

- Verification that I am pinging the other firewall on the HA link:

customername:/home/login # ping 198.19.250.2
PING 198.19.250.2 (198.19.250.2) 56(84) bytes of data.
64 bytes from 198.19.250.2: icmp_seq=1 ttl=64 time=0.155 ms
64 bytes from 198.19.250.2: icmp_seq=2 ttl=64 time=0.156 ms
64 bytes from 198.19.250.2: icmp_seq=3 ttl=64 time=0.246 ms
^C
--- 198.19.250.2 ping statistics ---
3 packets transmitted, 3 received, 0% packet loss, time 2003ms
rtt min/avg/max/mdev = 0.155/0.185/0.246/0.045 ms

- Checking the HA logs:

2022:01:25-14:24:12 customername-1 ha_daemon[4979]: id="38A0" severity="info" sys="System" sub="ha" seq="M: 251 12.413" name="Executing (nowait) /etc/init.d/ha_mode check"
2022:01:25-14:24:12 customername ha_mode[3002]: calling check
2022:01:25-14:24:12 customername ha_mode[3002]: check: waiting for last ha_mode done
2022:01:25-14:24:12 customername ha_mode[3002]: check_ha() role=MASTER, status=ACTIVE
2022:01:25-14:24:12 customername ha_mode[3002]: check done (started at 14:24:12)
2022:01:25-14:24:16 customername repctl[5075]: [i] recheck(1057): got ALRM: replication recheck triggered Setup_replication_done = 1
2022:01:25-14:27:25 customername2 repctl[4464]: [i] recheck(1057): got ALRM: replication recheck triggered Setup_replication_done = 1
2022:01:25-14:29:16 customername repctl[5075]: [i] recheck(1057): got ALRM: replication recheck triggered Setup_replication_done = 1
2022:01:25-14:32:25 customername2 repctl[4464]: [i] recheck(1057): got ALRM: replication recheck triggered Setup_replication_done = 1
2022:01:25-14:34:12 customername2 ha_daemon[4416]: id="38A0" severity="info" sys="System" sub="ha" seq="S: 158 12.023" name="Executing (wait) /usr/local/bin/confd-setha mode slave"
2022:01:25-14:34:12 customername2 ha_daemon[4416]: id="38A0" severity="info" sys="System" sub="ha" seq="S: 159 12.117" name="Executing (nowait) /etc/init.d/ha_mode check"
2022:01:25-14:34:12 customername2 ha_mode[23854]: calling check
2022:01:25-14:34:12 customername2 ha_mode[23854]: check: waiting for last ha_mode done
2022:01:25-14:34:12 customername2 ha_mode[23854]: check_ha() role=SLAVE, status=UNLINKED

- Checking the status of the HA service :

customername:/home/login # service ha_mode status
ha_mode[12752]: calling status
ha_mode[12752]: Missing HA_* variables, not called by ha_daemon? (exit 2)

- Test to disconnect the HA on 25.01.2022 between 12h40 and 12h44 -> Nothing comes up, no VPN, no access to the portal by the public IP...

Can you help me to solve this very worrying problem because it means that if there is a problem, the customer has no more production.

Best regards,
Raphaëlle


This thread was automatically locked due to age.
Parents
  • Hello Raphaëlle,

    As your HA SLAVE is showing the status UNLINKED you must check the interfaces of the SLAVE node. Unfortunately this is not possible form the WebAdmin.

    To check the status:

    1. SSH to the MASTER node
    2. Connect to the SLAVE node with “ha_utils ssh”
    3. Check the interfaces with “ip link show”

    Best regards,

    Holger

  • Hello,

    Here you can see below the results of the commands: 

    <M> user@customername:/home/login > ha_utils ssh
    
    Connecting to slave 198.19.250.2
    loginuser@198.19.250.2's password:
    
    
    Sophos UTM
    (C) Copyright 2000-2021 Sophos Limited and others. All rights reserved.
    Sophos is a registered trademark of Sophos Limited and Sophos Group.
    All other product and company names mentioned are trademarks or registered
    trademarks of their respective owners.
    
    For more copyright information look at /doc/astaro-license.txt
    or http://www.astaro.com/doc/astaro-license.txt
    
    NOTE: If not explicitly approved by Sophos support, any modifications
          done by root will void your support.
    
    <S> user@customername:/home/login > ip link show
    5: eth3: <BROADCAST,MULTICAST,UP,LOWER_UP> mtu 2000 qdisc mq state UP mode DEFAULT group default qlen 1000
        link/ether 7c:5a:1c:48:c2:13 brd ff:ff:ff:ff:ff:ff
    

    Regards,

    Raphaelle

  • That is strange. There should be more interfaces visible and not eth3 only. (The unlinked interface can be any interface of the UTM)

    Can you switch to root with “su -” and check with “lshw -class network -short” if the other interfaces are recognized?

  • Oh sorry, i juste reduced the list to focus on the eth3 (HA link) only.

    Here, you have the complete command result : 

    <S> user@customername:/home/login > ip link show
    1: lo: <LOOPBACK,UP,LOWER_UP> mtu 65536 qdisc noqueue state UNKNOWN mode DEFAULT group default
        link/loopback 00:00:00:00:00:00 brd 00:00:00:00:00:00
    2: eth0: <BROADCAST,MULTICAST,UP,LOWER_UP> mtu 1500 qdisc mq state UP mode DEFAULT group default qlen 1000
        link/ether XXXX brd ff:ff:ff:ff:ff:ff
    3: eth1: <BROADCAST,MULTICAST,UP,LOWER_UP> mtu 1500 qdisc mq state UP mode DEFAULT group default qlen 1000
        link/ether XXXX brd ff:ff:ff:ff:ff:ff
    4: eth2: <BROADCAST,MULTICAST,UP,LOWER_UP> mtu 1500 qdisc mq state UP mode DEFAULT group default qlen 1000
        link/ether XXXX brd ff:ff:ff:ff:ff:ff
    5: eth3: <BROADCAST,MULTICAST,UP,LOWER_UP> mtu 2000 qdisc mq state UP mode DEFAULT group default qlen 1000
        link/ether XXXX brd ff:ff:ff:ff:ff:ff
    6: eth4: <NO-CARRIER,BROADCAST,MULTICAST,UP> mtu 1500 qdisc mq state DOWN mode DEFAULT group default qlen 1000
        link/ether XXXX brd ff:ff:ff:ff:ff:ff
    7: eth5: <BROADCAST,MULTICAST> mtu 1500 qdisc noop state DOWN mode DEFAULT group default qlen 1000
        link/ether XXXX brd ff:ff:ff:ff:ff:ff
    8: eth6: <BROADCAST,MULTICAST> mtu 1500 qdisc noop state DOWN mode DEFAULT group default qlen 1000
        link/ether XXXX brd ff:ff:ff:ff:ff:ff
    9: eth7: <BROADCAST,MULTICAST> mtu 1500 qdisc noop state DOWN mode DEFAULT group default qlen 1000
        link/ether XXXX brd ff:ff:ff:ff:ff:ff
    10: reds1: <BROADCAST,MULTICAST,UP,LOWER_UP> mtu 1500 qdisc noqueue state UNKNOWN mode DEFAULT group default
        link/ether XXXX brd ff:ff:ff:ff:ff:ff
    11: eth4.50@eth4: <NO-CARRIER,BROADCAST,MULTICAST,UP> mtu 1500 qdisc noqueue state LOWERLAYERDOWN mode DEFAULT group default
        link/ether XXXX brd ff:ff:ff:ff:ff:ff
    

    <S> customername:/XXX # lshw -class network -short
    H/W path           Device     Class          Description
    ========================================================
    /0/100/1c/0        eth0       network        I211 Gigabit Network Connection
    /0/100/1c.5/0      eth1       network        I211 Gigabit Network Connection
    /0/100/1c.6/0      eth2       network        I211 Gigabit Network Connection
    /0/100/1c.7/0      eth3       network        I211 Gigabit Network Connection
    /0/100/1d/0        eth4       network        I211 Gigabit Network Connection
    /0/100/1d.1/0/1/0  eth5       network        I211 Gigabit Network Connection
    /0/100/1d.1/0/2/0  eth6       network        I210 Gigabit Fiber Network Connection
    /0/100/1d.1/0/3/0  eth7       network        I210 Gigabit Fiber Network Connection
    /2                 reds1      network        Ethernet interface
    /3                 eth4.50    network        Ethernet interface

    Regards,

    Raphaelle

Reply
  • Oh sorry, i juste reduced the list to focus on the eth3 (HA link) only.

    Here, you have the complete command result : 

    <S> user@customername:/home/login > ip link show
    1: lo: <LOOPBACK,UP,LOWER_UP> mtu 65536 qdisc noqueue state UNKNOWN mode DEFAULT group default
        link/loopback 00:00:00:00:00:00 brd 00:00:00:00:00:00
    2: eth0: <BROADCAST,MULTICAST,UP,LOWER_UP> mtu 1500 qdisc mq state UP mode DEFAULT group default qlen 1000
        link/ether XXXX brd ff:ff:ff:ff:ff:ff
    3: eth1: <BROADCAST,MULTICAST,UP,LOWER_UP> mtu 1500 qdisc mq state UP mode DEFAULT group default qlen 1000
        link/ether XXXX brd ff:ff:ff:ff:ff:ff
    4: eth2: <BROADCAST,MULTICAST,UP,LOWER_UP> mtu 1500 qdisc mq state UP mode DEFAULT group default qlen 1000
        link/ether XXXX brd ff:ff:ff:ff:ff:ff
    5: eth3: <BROADCAST,MULTICAST,UP,LOWER_UP> mtu 2000 qdisc mq state UP mode DEFAULT group default qlen 1000
        link/ether XXXX brd ff:ff:ff:ff:ff:ff
    6: eth4: <NO-CARRIER,BROADCAST,MULTICAST,UP> mtu 1500 qdisc mq state DOWN mode DEFAULT group default qlen 1000
        link/ether XXXX brd ff:ff:ff:ff:ff:ff
    7: eth5: <BROADCAST,MULTICAST> mtu 1500 qdisc noop state DOWN mode DEFAULT group default qlen 1000
        link/ether XXXX brd ff:ff:ff:ff:ff:ff
    8: eth6: <BROADCAST,MULTICAST> mtu 1500 qdisc noop state DOWN mode DEFAULT group default qlen 1000
        link/ether XXXX brd ff:ff:ff:ff:ff:ff
    9: eth7: <BROADCAST,MULTICAST> mtu 1500 qdisc noop state DOWN mode DEFAULT group default qlen 1000
        link/ether XXXX brd ff:ff:ff:ff:ff:ff
    10: reds1: <BROADCAST,MULTICAST,UP,LOWER_UP> mtu 1500 qdisc noqueue state UNKNOWN mode DEFAULT group default
        link/ether XXXX brd ff:ff:ff:ff:ff:ff
    11: eth4.50@eth4: <NO-CARRIER,BROADCAST,MULTICAST,UP> mtu 1500 qdisc noqueue state LOWERLAYERDOWN mode DEFAULT group default
        link/ether XXXX brd ff:ff:ff:ff:ff:ff
    

    <S> customername:/XXX # lshw -class network -short
    H/W path           Device     Class          Description
    ========================================================
    /0/100/1c/0        eth0       network        I211 Gigabit Network Connection
    /0/100/1c.5/0      eth1       network        I211 Gigabit Network Connection
    /0/100/1c.6/0      eth2       network        I211 Gigabit Network Connection
    /0/100/1c.7/0      eth3       network        I211 Gigabit Network Connection
    /0/100/1d/0        eth4       network        I211 Gigabit Network Connection
    /0/100/1d.1/0/1/0  eth5       network        I211 Gigabit Network Connection
    /0/100/1d.1/0/2/0  eth6       network        I210 Gigabit Fiber Network Connection
    /0/100/1d.1/0/3/0  eth7       network        I210 Gigabit Fiber Network Connection
    /2                 reds1      network        Ethernet interface
    /3                 eth4.50    network        Ethernet interface

    Regards,

    Raphaelle

Children
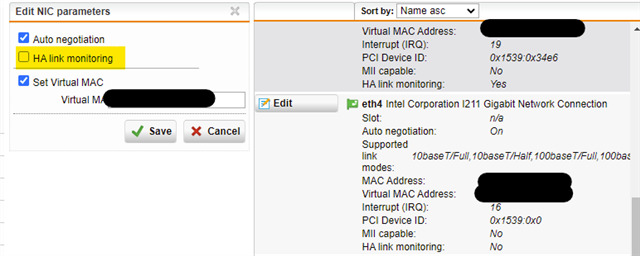
  • It seems eth4 is the interface in question. If this interface is not connected to an device, please disable the “HA link monitoring” for this interface in the WebAdmin.

  • Oh, I didn't understand that!
    The "UNLINKED" status means that one of the cables in HA monitoring mode is not connected on the SLAVE not just the HA cable (eth3)!

    I unchecked HA monitoring on eth4 and the SLAVE went to "READY".

    2022:01:26-13:37:34 customername-2 ha_daemon[4416]: id="38A0" severity="info" sys="System" sub="ha" seq="S:  211 34.504" name="Monitoring interfaces for link beat: eth2 eth1 eth0"
    2022:01:26-13:37:34 customername-2 ha_daemon[4416]: id="38A1" severity="warn" sys="System" sub="ha" seq="S:  212 34.504" name="All monitored interfaces with link again!"
    2022:01:26-13:37:34 customername-2 ha_daemon[4416]: id="38A0" severity="info" sys="System" sub="ha" seq="S:  213 34.504" name="state change UNLINKED(1) -> ACTIVE(0)"
    2022:01:26-13:37:34 customername-1 ha_daemon[4979]: id="38A0" severity="info" sys="System" sub="ha" seq="M:  307 34.837" name="Node 2 changed state: UNLINKED(1) -> ACTIVE(0)"
    2022:01:26-13:37:44 customername-1 ha_daemon[4979]: id="38A0" severity="info" sys="System" sub="ha" seq="M:  308 44.380" name="Monitoring interfaces for link beat: eth2 eth1 eth0"

    thanks to you !

    Best regards,
    Raphaelle