Help us enhance your Sophos Community experience. Share your thoughts in our Sophos Community survey.

[CONFIRMED] [7.386] HTTP Proxy and 100% CPU

I have [7.386] version on ASG320 from this morning (time 08:53).

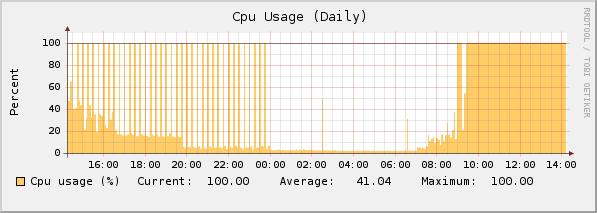
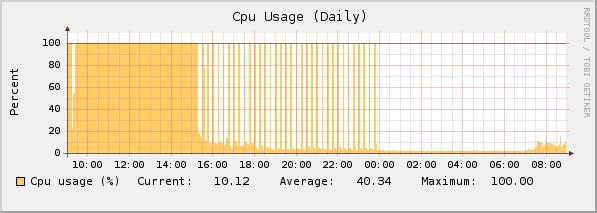
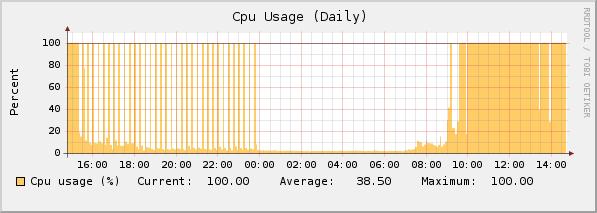
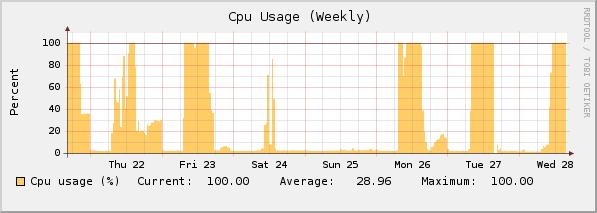
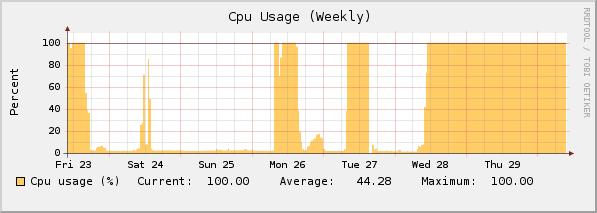
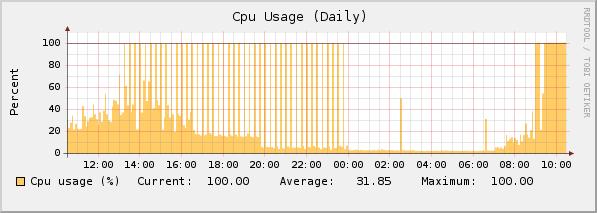
My Cpu Usage Graph have now allways 100% CPU


USER       PID %CPU %MEM    VSZ   RSS TTY      STAT START   TIME COMMAND
root         1  0.0  0.0    716   284 ?        S    08:54   0:00 init [3]  
root         2  0.0  0.0      0     0 ?        SN   08:54   0:00 [ksoftirqd/0]
root         3  0.0  0.0      0     0 ?        S
root      2888  0.0  1.0  13636 10604 ?        Ss   08:54   0:02 dns-resolver.plx
root      2938  0.0  0.5   8172  5252 ?        S    08:54   0:00 /usr/local/bin/sysmond
root      2980  0.0  0.9  15816 10212 ?        Ss   08:54   0:00 /var/aua/aua.bin
root     15192  0.0  0.0      0     0 ?        Z    10:40   0:00  \_ [aua.bin] 
root      3002  0.0  1.1  17560 11440 ?        S    08:54   0:00 /usr/local/bin/notifier.plx
root      3038  0.0  0.0   1808   716 ?        Ss   08:54   0:00 /usr/sbin/cron
root      3103  0.0  0.0   1760   452 ?        Ss   08:54   0:00 /usr/local/bin/asg_ha_zeroconf
postgres  3128  0.0  0.5  48812  5344 ?        S    08:54   0:00 /usr/bin/postgres -D /var/storage/pgsql/data
postgres  3134  0.0  2.8  48948 28992 ?        Ss   08:55   0:00  \_ postgres: writer process                    
postgres  3135  0.0  0.0  48812   988 ?        Ss   08:55   0:00  \_ postgres: wal writer process                
postgres  3136  0.0  0.1  49108  1336 ?        Ss   08:55   0:00  \_ postgres: autovacuum launcher process       
postgres  3137  0.0  0.1   6964  1064 ?        Ss   08:55   0:00  \_ postgres: stats collector process           
postgres  4048  0.4  2.8  49636 29740 ?        Ss   08:55   0:27  \_ postgres: reporting reporting [local] idle  
postgres  4291  0.0  0.7  49992  7520 ?        Ss   08:55   0:00  \_ postgres: postgres smtp 127.0.0.1(46020) idle
postgres 15312  0.1  0.4  50024  4372 ?        Ss   10:41   0:00  \_ postgres: postgres smtp 127.0.0.1(49941) idle
root      3179  0.1  6.8  73288 70140 ?        S    08:55   0:11 /var/mdw/mdw_daemon.plx
root      3213  0.2  0.8  13816  8508 ?        S    08:55   0:16 /usr/local/bin/selfmonng.plx
root      3266  0.0  0.6  13556  6340 ?        S    08:55   0:00  \_ [timewarp check]
root      3224  0.0  0.0   1504   512 ?        Ss   08:55   0:00 /usr/local/bin/daemon-watcher selfmonng.plx /usr/local/bin/selfmonn
root      3225  0.0  0.0   1708   676 tty1     Ss+  08:55   0:00 /sbin/mingetty --noclear --no-hostname tty1
root      3226  0.0  0.0   1708   676 tty2     Ss+  08:55   0:00 /sbin/mingetty --no-hostname tty2
root      3227  0.0  0.0   1708   656 tty3     Ss+  08:55   0:00 /sbin/mingetty --no-hostname tty3
root      3228  0.0  0.0   1712   660 tty4     Ss+  08:55   0:00 /sbin/mingetty --no-hostname tty4
root      3328  1.1  0.1   3268  1592 ?        S
  • Is it possible to get a login to your Box, so i can check what the proxy is doing?

    Cheers,

    Sven.
  • I send you on private massage login data to my box.

    Cpu Usage - now
  • Maybe issue is with bypass content scanning for streaming content.
    Now, after most people end work at 15:30 CPU usage is normal.
  • You are not telling us you use that beta in production environment, right? [:O]
  • Similar issue here - running CPU at 50% since 10.30pm last night.  HTTP proxy is the process causing the problem.
  • Yes I have two box and now one of them use to testing beta version in production environment where I build config from scratch. Second box have stable version v7.305 with old config.

    I apologize, that I forgot to write about this earlier.


    Regards,
    WaMaR
  • Today 100% CPU again. They are interesting strange high values on the graph from today afternoon to midnight. 

  • Today, I define  Exceptions at Web Security » HTTP/S Menu for testing CPU load for domains from my "Web Security Statistics - Today".

    My rule skipping:    Authentication / Antivirus / Extension blocking / MIME type blocking / URL Filter / Content Removal

    Top domains by time spent 
    Total unique domains: 1 382 Total traffic: 3.4 GB
    Domain                         Time                  spent % 
    1 gemius.pl                211:43:59                 23.32 
    2 google-analytics.com      58:17:26                  6.42 
    3 doubleclick.net           39:12:34                  4.32  
    5 adocean.pl                35:44:30                  3.94 
    6 tradedoubler.com          30:27:35                  3.35 
    Tomorrow, I will see if this rule was helpful.
  • Unfortunately, it hasn't helped [:@]. My users still generate 100% cpu usage. 


    but my Process List shows only 20%cpu for httpproxy:


    USER       PID %CPU %MEM    VSZ   RSS TTY      STAT START   TIME COMMAND
    root         1  0.0  0.0    716   280 ?        S    Jan27   0:00 init [3]  
    root         2  0.0  0.0      0     0 ?        SN   Jan27   0:00 [ksoftirqd/0]
    root         3  0.0  0.0      0     0 ?        S
    root      2872  0.1  1.0  13648 10616 ?        Ss   Jan27   1:37 dns-resolver.plx
    root      2917  0.0  0.5   8172  5244 ?        S    Jan27   0:01 /usr/local/bin/sysmond
    root      2978  0.0  0.9  15816 10208 ?        Ss   Jan27   0:00 /var/aua/aua.bin
    root     11133  0.0  0.0      0     0 ?        Z    15:33   0:00  \_ [aua.bin] 
    root      2992  0.0  1.2  18812 12700 ?        S    Jan27   0:01 /usr/local/bin/notifier.plx
    root      3029  0.0  0.0   1804   712 ?        Ss   Jan27   0:00 /usr/sbin/cron
    root      3094  0.0  0.0   1760   448 ?        Ss   Jan27   0:00 /usr/local/bin/asg_ha_zeroconf
    postgres  3119  0.0  0.5  48816  5356 ?        S    Jan27   0:01 /usr/bin/postgres -D /var/storage/pgsql/data
    postgres  3125  0.0  3.3  48952 34860 ?        Ss   Jan27   0:00  \_ postgres: writer process                    
    postgres  3126  0.0  0.0  48816  1004 ?        Ss   Jan27   0:00  \_ postgres: wal writer process                
    postgres  3127  0.0  0.1  49112  1344 ?        Ss   Jan27   0:00  \_ postgres: autovacuum launcher process       
    postgres  3128  0.0  0.1   6968  1076 ?        Ss   Jan27   0:01  \_ postgres: stats collector process           
    postgres  3964  0.0  3.2  49640 33496 ?        Ss   Jan27   1:11  \_ postgres: reporting reporting [local] idle  
    postgres  4361  0.0  1.4  50052 15220 ?        Ss   Jan27   0:01  \_ postgres: postgres smtp 127.0.0.1(58143) idle
    postgres 13473  0.1  0.4  50028  4896 ?        Ss   16:04   0:00  \_ postgres: postgres smtp 127.0.0.1(44839) idle
    root      3166  0.0  6.7  72888 69740 ?        S    Jan27   0:13 /var/mdw/mdw_daemon.plx
    root      3194  0.2  0.8  13812  8504 ?        S    Jan27   3:03 /usr/local/bin/selfmonng.plx
    root      3235  0.0  0.6  13552  6336 ?        S    Jan27   0:00  \_ [timewarp check]
    root      3202  0.0  0.0   1500   508 ?        Ss   Jan27   0:00 /usr/local/bin/daemon-watcher selfmonng.plx /usr/local/bin/selfmonn
    root      3203  0.0  0.0   1708   680 tty1     Ss+  Jan27   0:00 /sbin/mingetty --noclear --no-hostname tty1
    root      3204  0.0  0.0   1708   676 tty2     Ss+  Jan27   0:00 /sbin/mingetty --no-hostname tty2
    root      3205  0.0  0.0   1712   664 tty3     Ss+  Jan27   0:00 /sbin/mingetty --no-hostname tty3
    root      3206  0.0  0.0   1708   656 tty4     Ss+  Jan27   0:00 /sbin/mingetty --no-hostname tty4
    root      3333  0.2  0.1   3008  1312 ?        S
  • Please, tell me what is wrong with httpproxy process. Maybe is somthing to do for workaround this issue.