Important note about SSL VPN compatibility for 20.0 MR1 with EoL SFOS versions and UTM9 OS. Learn more in the release notes.

ips.log filling at high rate - normal and good for the SSD lifetime?

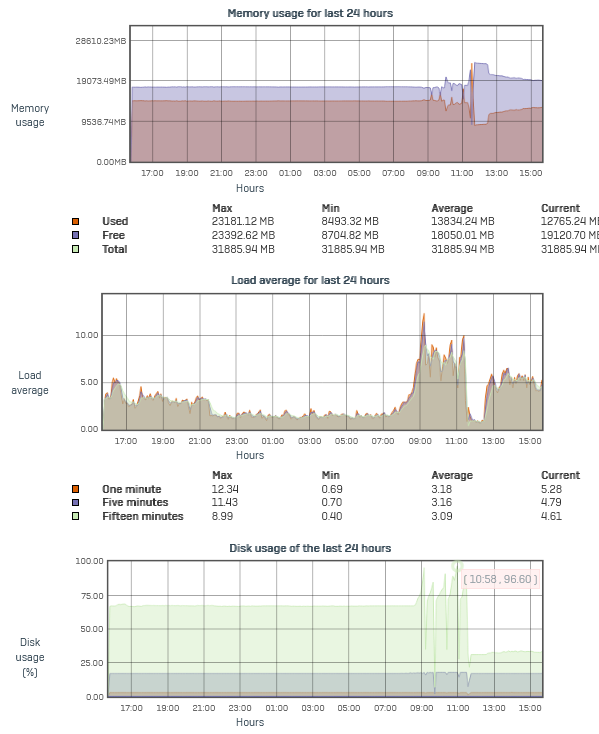
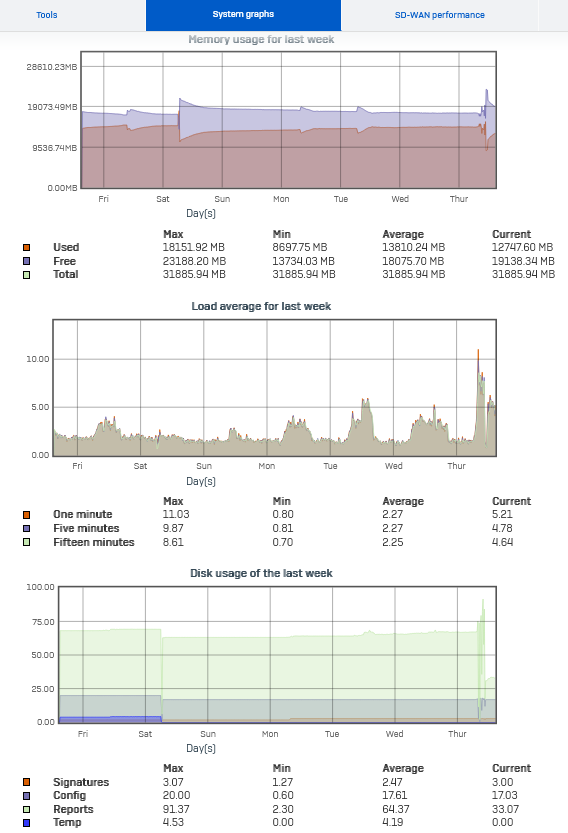
Today we've had a partial outage due to high /var partition usage.

It was flapping between 70% and over 90% in a short time.

/dev/var                179.3G    138.6G     40.7G  77% /var
/dev/var                179.3G    138.8G     40.5G  77% /var
/dev/var                179.3G    138.9G     40.4G  77% /var
/dev/var                179.3G    139.0G     40.3G  77% /var
/dev/var                179.3G    131.0G     48.3G  73% /var
/dev/var                179.3G    135.7G     43.6G  76% /var
/dev/var                179.3G    141.5G     37.8G  79% /var
/dev/var                179.3G    141.6G     37.7G  79% /var
/dev/var                179.3G    141.7G     37.6G  79% /var
/dev/var                179.3G    141.8G     37.5G  79% /var
/dev/var                179.3G    144.4G     34.8G  81% /var
/dev/var                179.3G    137.8G     41.5G  77% /var
/dev/var                179.3G    137.9G     41.4G  77% /var
/dev/var                179.3G    138.0G     41.3G  77% /var
/dev/var                179.3G    139.5G     39.8G  78% /var
/dev/var                179.3G    146.0G     33.3G  81% /var
/dev/var                179.3G    143.0G     36.3G  80% /var
/dev/var                179.3G    144.3G     35.0G  80% /var
/dev/var                179.3G    124.5G     54.8G  69% /var
/dev/var                179.3G    124.6G     54.7G  69% /var
/dev/var                179.3G    124.7G     54.6G  70% /var
/dev/var                179.3G    124.8G     54.5G  70% /var
/dev/var                179.3G    124.9G     54.4G  70% /var
/dev/var                179.3G    125.1G     54.2G  70% /var
/dev/var                179.3G    125.4G     53.9G  70% /var
/dev/var                179.3G    171.1G      8.1G  95% /var
/dev/var                179.3G    148.8G     30.5G  83% /var
/dev/var                179.3G    155.9G     23.4G  87% /var
/dev/var                179.3G    146.0G     33.3G  81% /var
/dev/var                179.3G    144.5G     34.8G  81% /var
/dev/var                179.3G     55.2G    124.1G  31% /var
/dev/var                179.3G     55.3G    124.0G  31% /var
/dev/var                179.3G     56.4G    122.9G  31% /var
/dev/var                179.3G     56.8G    122.5G  32% /var

Firewall was rotating the IPS Logs at a high rate and compressing them caused additional CPU load.

The heartbeat service failed as secondary issue causing heartbeat rules not to work any more.

Also we've had a huge ammount of these IPS detections:

20583
BROWSER-FIREFOX Mozilla multiple location headers malicious redirect attempt

Together with Support on the phone, we flushed the report partition and rebooted the firewall after stopping IPS.

/var was at 31% then.

IPS was manually started again after the reboot.

Now it seem to me IPS is still logging at a high rate. about 1GB to the text file /log/ips.log per Minute.

Support could not find issues related to IPS.

I'm unsure.

I wonder if such a high log rate is normal for IPS and if this is OK for the SSD?

XGS4500_AM02_SFOS 21.0.0 GA-Build169 HA-Primary# ls -lhS ips.*
-rw-r--r--    1 root     root       24.4G Nov 21 11:22 ips.log-20241121_111359
-rw-r--r--    1 root     root        1.0G Nov 21 13:16 ips.log
-rw-r--r--    1 root     root      123.4M Nov 21 13:06 ips.log-20241121_130655.gz
-rw-r--r--    1 root     root      116.9M Nov 21 13:11 ips.log-20241121_131102.gz
-rw-r--r--    1 root     root      109.3M Nov 21 13:14 ips.log-20241121_131454.gz
-rw-r--r--    1 root     root      105.8M Nov 21 13:13 ips.log-20241121_131303.gz
-rw-r--r--    1 root     root      102.8M Nov 21 13:09 ips.log-20241121_130901.gz
XGS4500_AM02_SFOS 21.0.0 GA-Build169 HA-Primary# head /log/ips.log
2024-11-21T12:15:07.934223Z [25339] daq_metadata session id 5158 rev 36361 appid 106  hbappid 0 idp 14 appfltid 0
2024-11-21T12:15:07.935265Z [25340] daq_metadata session id 19208 rev 51831 appid 106  hbappid 0 idp 14 appfltid 0

Log is filling even when this is still disabled (disabled during case debug today)

Support case is 02034074 


changed topic "hat" high rate -> at high rate
[bearbeitet von: LHerzog um 1:38 PM (GMT -8) am 21 Nov 2024]
  • showing the secondary heartbeat issue:

    XGS4500_AM02_SFOS 21.0.0 GA-Build169 HA-Primary# tail /log/heartbeatd.log
    gr_io: Broken pipe, Offset => 0
    gr_io: Resource temporarily unavailable, after retrying 5 times
    gr_io: Resource temporarily unavailable, after retrying 5 times
    gr_io: Resource temporarily unavailable, after retrying 5 times
    gr_io: Resource temporarily unavailable, after retrying 5 times

    I think this is dangerous. Why do do these huge unzipped files remain in /log dir?

    Having a few of them and the disk will be full again


    XGS4500_AM02_SFOS 21.0.0 GA-Build169 HA-Primary# ls -lhS ips.*
    -rw-r--r--    1 root     root       24.4G Nov 21 11:22 ips.log-20241121_111359
    -rw-r--r--    1 root     root        4.0G Nov 21 13:47 ips.log
    -rw-r--r--    1 root     root        3.3G Nov 21 13:46 ips.log-20241121_134627
    -rw-r--r--    1 root     root      185.0M Nov 21 13:40 ips.log-20241121_134007.gz
    -rw-r--r--    1 root     root      169.3M Nov 21 13:43 ips.log-20241121_134303.gz
    -rw-r--r--    1 root     root      157.1M Nov 21 13:32 ips.log-20241121_133215.gz
    -rw-r--r--    1 root     root      145.8M Nov 21 13:37 ips.log-20241121_133715.gz
    -rw-r--r--    1 root     root      142.5M Nov 21 13:34 ips.log-20241121_133445.gz
    #logrotate#
    XGS4500_AM02_SFOS 21.0.0 GA-Build169 HA-Primary# ls -lhS ips.*
    -rw-r--r--    1 root     root       24.4G Nov 21 11:22 ips.log-20241121_111359
    -rw-r--r--    1 root     root        3.3G Nov 21 13:46 ips.log-20241121_134627
    -rw-r--r--    1 root     root      306.3M Nov 21 13:47 ips.log
    -rw-r--r--    1 root     root      185.0M Nov 21 13:40 ips.log-20241121_134007.gz
    -rw-r--r--    1 root     root      169.3M Nov 21 13:43 ips.log-20241121_134303.gz
    -rw-r--r--    1 root     root      157.1M Nov 21 13:32 ips.log-20241121_133215.gz
    -rw-r--r--    1 root     root      145.8M Nov 21 13:37 ips.log-20241121_133715.gz
    -rw-r--r--    1 root     root      142.5M Nov 21 13:34 ips.log-20241121_133445.gz
    -rw-r--r--    1 root     root       34.1M Nov 21 13:47 ips.log-20241121_134627.gz
    XGS4500_AM02_SFOS 21.0.0 GA-Build169 HA-Primary# date
    Thu Nov 21 13:47:33 CET 2024

  • Maybe someone in a older support ID enabled IPS Debugging? 

    __________________________________________________________________________________________________________________

  • no, IPS was not in debug.

    When we enabled IPS debug today the fill rate was not much changed to without debug.

  • Did you create for this XGS Appliance an case before? Because it looks like, there was special debugging enabled. 

    __________________________________________________________________________________________________________________

  • Hello,

    Can you share the output of below?

    cat /log/applog.log | grep -i "log_rotate:exec Failed"

    Mayur Makvana
    Technical Account Manager | Global Customer Experience

    Sophos Support Videos | Knowledge Base  |  @SophosSupport | Sign up for SMS Alerts |
    If a post solves your question please use the 'Verify Answer' button.

  • Hello,

    Regret to hear about your issue. Thank you for sharing support case, we shall be tracking progress on our end.

    Thank you for your patience

    Regards,

    Raphael Alganes
    Community Support Engineer | Sophos Technical Support
    Sophos Support Videos Product Documentation  |  @SophosSupport  | Sign up for SMS Alerts
    If a post solves your question use the 'Verify Answer' link.

  • sure

    no results.


    cat /log/applog.log* | grep -i "log_rotate:exec Failed"

    ls applog.log* -l
    -rw-r--r--    1 root     root      28427822 Nov 21 14:12 applog.log
    -rw-r--r--    1 root     root       2933453 Nov 14 09:14 applog.log-20241114_091429.gz
    -rw-r--r--    1 root     root       3938860 Nov 14 15:15 applog.log-20241114_151521.gz
    -rw-r--r--    1 root     root       2939131 Nov 15 06:48 applog.log-20241115_064840.gz
    -rw-r--r--    1 root     root       3690161 Nov 15 14:11 applog.log-20241115_141123.gz
    -rw-r--r--    1 root     root       3148974 Nov 16 04:24 applog.log-20241116_042414.gz

    zcat /log/applog.*.gz | grep -i "log_rotate:exec Failed"

    cat /log/applog.log | grep -i "failed"

    ...
    Nov 21 04:10:00Z SendAppFeedback: app-feedback command failed. Details can be found in /log/app-feedback.log
    Nov 21 06:30:20Z getModuleInformation opcode failed
    Nov 21 06:30:20Z getModuleInformation opcode failed
    Nov 21 09:04:20Z Get random adminpassword state failed
    Nov 21 09:19:06Z Get random adminpassword state failed
    next logs are after the reboot.

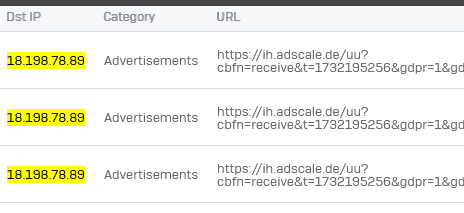
  • for the IPS Drops we're seeing massively today it seems to be related to this URL

    2024-11-21 10:07:26Web filtermessageid="16001" log_type="Content Filtering" log_component="HTTP" log_subtype="Allowed" fw_rule_id="2" fw_rule_name="User-2-WAN" fw_rule_section="Local rule" user="user@domain" user_group="OU=OU,DC=domain" web_policy_id="4" web_policy="OUR_DefaultPolicy" category="Advertisements" category_type="Unproductive" url="https://ih.adscale.de/adscale-ih/tpui?tpid=48&tpuid=-###truncated###-ayA4IB" content_type="" override_token="" src_ip="172.xxx.xxx.82" dst_ip="3.120.35.187" protocol="TCP" src_port="60035" dst_port="443" bytes_sent="1489" bytes_received="2603" domain="ih.adscale.de" exception="" activity_name="" reason="" user_agent="Mozilla/5.0 (Windows NT 10.0; Win64; x64; rv:128.0) Gecko/20100101 Firefox/128.0" status_code="302" transaction_id="feeedb56-f36f-46cf-a9f7-be58abb1c5e0" referer="" download_file_name="" download_file_type="" upload_file_name="" upload_file_type="" con_id="500959744" app_name="" app_is_cloud="0" override_name="" override_authorizer="" used_quota="0"

    2024-11-21 10:07:26IPSmessageid="07002" log_type="IDP" log_component="Signatures" log_subtype="Drop" ips_policy="" ips_policy_id="16" fw_rule_id="2" fw_rule_name="User-2-WAN" fw_rule_section="Local rule" user="user@domain" sig_id="20583" message="BROWSER-FIREFOX Mozilla multiple location headers malicious redirect attempt" classification="Web Application Attack" rule_priority="3" src_ip="3.120.35.187" src_country="DEU" dst_ip="172.xxx.xxx.82" dst_country="R1" protocol="TCP" src_port="443" dst_port="60035" OS="Windows" category="browser-firefox" victim="Client"

    also for other IPs

    we'll block this FQDN

  • the 24GB ips stale log file has been archived and then deleted manually.
    and two other screenshots