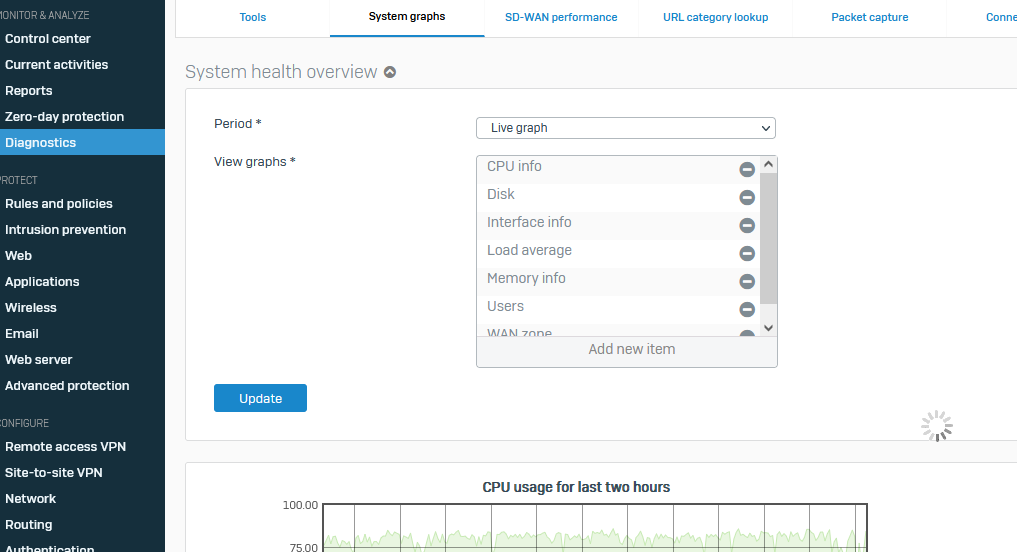
On our XG430 firewall we have some interfaces
only the active ones are ~40 VLANs, ~40 REDs, ~30 virtual WiFi networks and adapters, ~10 physical interfaces
Currently I monitor CPU load from time to time. Unfortunately, due to all graphs are preselected, the machine will automatically load performance statistics for all interfaces. That takes 20-30 seconds to load the page (you see the spinning java circle). You cannot click anything else when it is loading.
I then unselect Interface info and then the page loads fine and quick.
I wonder if there are no more complaints about the performance on that page? Firewalls are supposed to have many gateway interfaces to give adequate network scanning protection.
I suppose it is also slow on the larger machines, as rendering the graphs with Java simply takes some time.
Probably it would be better, to have some objects not preselected. Or better, dynamically determine first how many interfaces exist and if it are more then lets say 10, unselect the interfaces automatically.

This thread was automatically locked due to age.

