This discussion has been locked.
You can no longer post new replies to this discussion. If you have a question you can start a new discussion

snort high CPU

Hi,

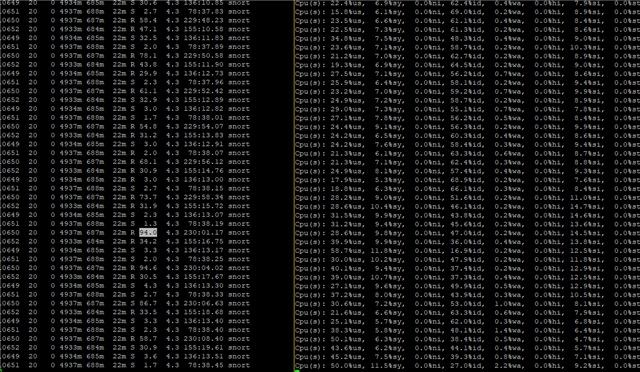
in the last few days something was causing after about 30 minutes almost 100% CPU for snort. No high traffic on any interface. It takes about 1-2 minutes. In ips.log I can see:

[Jan 14 21:58:22 :1133]:failed to get sessiontbl data for session id 9441 rev 52778 pkt_len 40 datalink_type 228 direction 1 daq_source 0 is_tcp 1 nseid 0 is_ssl_non_app_appdata 0, dropping packet
[Jan 14 21:58:22 :1133]:Error reading session data,status -1
[Jan 14 21:58:22 :1133]:failed to get sessiontbl data for session id 17038 rev 53026 pkt_len 52 datalink_type 228 direction 1 daq_source 0 is_tcp 1 nseid 0 is_ssl_non_app_appdata 0, dropping packet
[Jan 14 21:58:22 :1133]:Error reading session data,status -1
[Jan 14 21:58:22 :1133]:failed to get sessiontbl data for session id 18535 rev 23402 pkt_len 48 datalink_type 228 direction 1 daq_source 0 is_tcp 1 nseid 0 is_ssl_non_app_appdata 0, dropping packet
[Jan 14 21:58:22 :1133]:Error reading session data,status -1
[Jan 14 21:58:22 :1133]:failed to get sessiontbl data for session id 10039 rev 48232 pkt_len 52 datalink_type 228 direction 1 daq_source 0 is_tcp 1 nseid 0 is_ssl_non_app_appdata 0, dropping packet
[Jan 14 21:58:22 :1133]:Error reading session data,status -1

How to find the reason of this ? I have SFOS 18.0.4.


This thread was automatically locked due to age.
Parents
  • Hello there,

    Thank you for contacting the Sophos Community!

    Do you see any coredump under /var/cores?

    You could check syslog.log and csc.log around the time of the issue to see if they have any info.

    Regards,


    Emmanuel (EmmoSophos)
    Technical Team Lead, Global Community Support
    Sophos Support VideosProduct Documentation  |  @SophosSupport  | Sign up for SMS Alerts
    If a post solves your question use the 'Verify Answer' link.
  • Hello,

    no, there are no coredumps.

    In syslog.log  I don't see anything so it would be different from running at other times

    In csc.log  I don't see anything so it would be different from running at other times

    Regards,

  • I notice also times with high snort load. Seems higher than usual in our environment.

    No dumps.

    Still the "old" Snort rules:

    IPS and Application signatures
    18.17.78
    -
    18:26:36, Jan 13 2021

    What has become with IPS after Jan 15th? Sophos announced a change so I had expected some "brandnew" IPS patterns or so, but it seems, nothing has happened.

    Also note this recent thread  - I reported no unusual activity there some days ago but maybe there are...?

    community.sophos.com/.../ips-service-makes-cpu-up-to-100-this-morning

  • The change was to do with end of life support for older versions of XG.

    ian

    XG115W - v20 GA - Home

    XG on VM 8 - v20 GA

    If a post solves your question please use the 'Verify Answer' button.

  • [Jan 19 11:39:49 :10649]:failed to get sessiontbl data for session id 5631 rev 15943 pkt_len 0 datalink_type 228 direction 0 daq_source 2 is_tcp 0 nseid 0 is_ssl_non_app_appdata 0, dropping packet
    [Jan 19 11:39:49 :10649]:Error reading session data,status -1
    [Jan 19 11:39:49 :10649]:failed to get sessiontbl data for session id 5631 rev 15943 pkt_len 0 datalink_type 228 direction 0 daq_source 2 is_tcp 0 nseid 0 is_ssl_non_app_appdata 0, dropping packet
    [Jan 19 11:40:46:393894 :10652]:DAQ:INFO:daq_ssl.c:1008(ssl_daq_send_pkt_and_verd)--> [S:5552.38070]Ignore flow failed, nse_ret 0xB4000F0F
    [Jan 19 11:40:53:514852 :10652]:DAQ:INFO:daq_ssl.c:1008(ssl_daq_send_pkt_and_verd)--> [S:2876.16105]Ignore flow failed, nse_ret 0xB4000F0F
    

    UST sessiontbl_get_tuple API returned -1[Jan 19 12:20:36:653718 :10650]:DAQ:INFO:daq_nmsp.c:3155(common_inject)--> [S:4342.52039]Unable to get the tuple info from the kernel conntrack for injection. dir 1, pkt length 1340
    

    recent IPS sample logs. similar logs like from  Cannot say if it is common logs or indicating issues. Have not monitored ips log frequently in the past.

  • Hello Ladislav,

    Thank you for the follow-up!

    I checked my XG and see the same entries, however, didn't find a reason for this, so I will try to get some info on this, however, I am not sure if these messages are the cause of the high CPU usage, I would recommend you to follow this KB to follow resource utilization and open a case with Support (Send me the Case ID) if the issue happens again.

    Regards,


    Emmanuel (EmmoSophos)
    Technical Team Lead, Global Community Support
    Sophos Support VideosProduct Documentation  |  @SophosSupport  | Sign up for SMS Alerts
    If a post solves your question use the 'Verify Answer' link.
Reply Children