

Symptoms:
- High CPU
- DNS queries timing out
- confd.plx restarting continuously
- Numerous errors in confd.log and confd-debug.log
Since DNS-queries are timing out none of the clients can do much on the WWW.
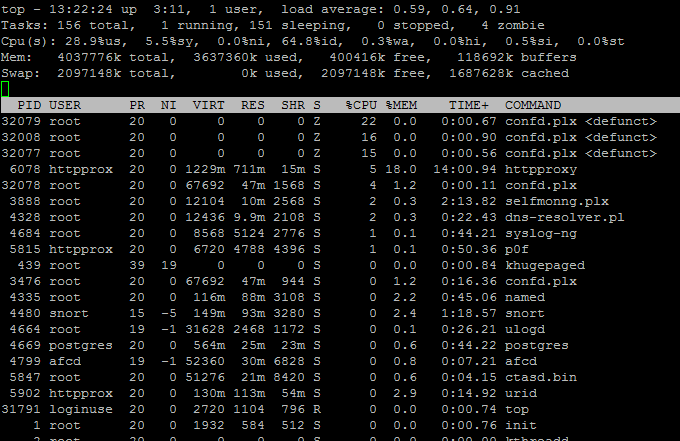
Top snippets:
top - 13:23:36 up 3:12, 1 user, load average: 0.54, 0.61, 0.87Tasks: 155 total, 2 running, 151 sleeping, 0 stopped, 2 zombieCpu(s): 58.3%us, 3.8%sy, 0.0%ni, 35.5%id, 1.5%wa, 0.0%hi, 0.8%si, 0.0%stMem: 4037776k total, 3686020k used, 351756k free, 118996k buffersSwap: 2097148k total, 0k used, 2097148k free, 1688392k cached
PID USER PR NI VIRT RES SHR S %CPU %MEM TIME+ COMMAND32165 postgres 20 0 608m 60m 14m R 95 1.5 0:07.26 postgres32167 root 20 0 0 0 0 Z 16 0.0 0:00.58 confd.plx <defunct>32169 root 20 0 67692 47m 1568 S 4 1.2 0:00.11 confd.plx6078 httpprox 20 0 1229m 711m 15m S 3 18.0 14:03.55 httpproxy4669 postgres 20 0 564m 25m 23m S 2 0.6 0:44.51 postgres4480 snort 15 -5 149m 93m 3280 S 1 2.4 1:19.01 snort4335 root 20 0 116m 88m 3108 S 1 2.2 0:45.30 named
top - 13:22:45 up 3:11, 1 user, load average: 0.53, 0.62, 0.89Tasks: 154 total, 1 running, 151 sleeping, 0 stopped, 2 zombieCpu(s): 10.2%us, 2.7%sy, 0.0%ni, 86.1%id, 0.7%wa, 0.0%hi, 0.3%si, 0.0%stMem: 4037776k total, 3637864k used, 399912k free, 118780k buffersSwap: 2097148k total, 0k used, 2097148k free, 1687744k cached
PID USER PR NI VIRT RES SHR S %CPU %MEM TIME+ COMMAND32096 root 20 0 0 0 0 Z 15 0.0 0:00.55 confd.plx <defunct>32097 root 20 0 67692 47m 1568 S 3 1.2 0:00.10 confd.plx3888 root 20 0 12104 10m 2568 S 2 0.3 2:14.05 selfmonng.plx4669 postgres 20 0 564m 25m 23m S 1 0.6 0:44.29 postgres6078 httpprox 20 0 1229m 711m 15m S 1 18.0 14:01.23 httpproxy3 root 20 0 0 0 0 S 0 0.0 0:23.67 ksoftirqd/03413 upsd 20 0 2420 620 376 S 0 0.0 0:02.45 usbhid-ups
confd.log
2017:06:03-14:39:28 utm confd[3330]: W main::cleanup_sessions:1038() => id="3100" severity="warn" sys="System" sub="confd" name="timeout: removing session" user="system" srcip="127.0.0.1" sid="MvqaGDewxZanMJxGwpgD" facility="system" client="websecreporter"2017:06:03-14:39:28 utm confd[3330]: W main::cleanup_sessions:1038() => id="3100" severity="warn" sys="System" sub="confd" name="timeout: removing session" user="system" srcip="127.0.0.1" sid="PacitgDMItOdLcPDtoaI" facility="system" client="httpproxy"2017:06:03-14:39:28 utm confd[3330]: W main::cleanup_sessions:1038() => id="3100" severity="warn" sys="System" sub="confd" name="timeout: removing session" user="system" srcip="127.0.0.1" sid="PRZIUUWbDgBcyfihpgho" facility="system" client="websecreporter"2017:06:03-14:39:28 utm confd[3330]: W main::cleanup_sessions:1038() => id="3100" severity="warn" sys="System" sub="confd" name="timeout: removing session" user="system" srcip="127.0.0.1" sid="ryXbhyPUcPlZOZHvlGJJ" facility="system" client="websecreporter"2017:06:03-14:39:28 utm confd[3330]: W main::cleanup_sessions:1038() => id="3100" severity="warn" sys="System" sub="confd" name="timeout: removing session" user="system" srcip="127.0.0.1" sid="sFwRauMfraAYcEVebJMS" facility="system" client="websecreporter"2017:06:03-14:39:28 utm confd[3330]: W main::cleanup_sessions:1038() => id="3100" severity="warn" sys="System" sub="confd" name="timeout: removing session" user="system" srcip="127.0.0.1" sid="tuJFxZMjmTMNRaIMkMWx" facility="system" client="websecreporter"
confd-debug.log
2017:06:03-14:43:09 utm confd[13776]: D Session::terminate:290() => id="3100" severity="debug" sys="System" sub="confd" name="closing session" user="system" srcip="127.0.0.1" sid="fVCoGqJzWcxvAMmqpfNl" facility="system" client="awed [master]" call="logout" function="logout"2017:06:03-14:43:09 utm confd[13776]: D sys::DESTROY:231() => id="3100" severity="debug" sys="System" sub="confd" name="worker process exiting" user="system" srcip="127.0.0.1" facility="system" client="awed [master]"2017:06:03-14:43:09 utm confd[13779]: D Role::authenticate:185() => id="3106" severity="debug" sys="System" sub="confd" name="authentication successful" user="system" srcip="127.0.0.1" sid="PQTsCyFxQcgrqRhEoBNO" facility="system" client="awed [master]" call="new"<31>Jun 3 14:43:09 confd[13779]: D sys::AUTOLOAD:303() => id="3100" severity="debug" sys="System" sub="confd" name="external call" user="system" srcip="127.0.0.1" facility="system" client="awed [master]" lock="none" method="get_SID"2017:06:03-14:43:09 utm confd[13779]: D sys::AUTOLOAD:303() => id="3100" severity="debug" sys="System" sub="confd" name="external call" user="system" srcip="127.0.0.1" facility="system" client="awed [master]" lock="none" method="get_objects"2017:06:03-14:43:12 utm confd[13779]: D sys::AUTOLOAD:303() => id="3100" severity="debug" sys="System" sub="confd" name="external call" user="system" srcip="127.0.0.1" facility="system" client="awed [master]" lock="none" method="logout"2017:06:03-14:43:12 utm confd[13779]: D Session::terminate:290() => id="3100" severity="debug" sys="System" sub="confd" name="closing session" user="system" srcip="127.0.0.1" sid="PQTsCyFxQcgrqRhEoBNO" facility="system" client="awed [master]" call="logout" function="logout"2017:06:03-14:43:12 utm confd[13779]: D sys::DESTROY:231() => id="3100" severity="debug" sys="System" sub="confd" name="worker process exiting" user="system" srcip="127.0.0.1" facility="system" client="awed [master]"2017:06:03-14:43:12 utm confd[13780]: D Role::authenticate:185() => id="3106" severity="debug" sys="System" sub="confd" name="authentication successful" user="system" srcip="127.0.0.1" sid="PcQGchybtWFXUUaNcMEb" facility="system" client="awed [master]" call="new"<31>Jun 3 14:43:12 confd[13780]: D sys::AUTOLOAD:303() => id="3100" severity="debug" sys="System" sub="confd" name="external call" user="system" srcip="127.0.0.1" facility="system" client="awed [master]" lock="none" method="get_SID"
http.log (numerous entries like this one)
2017:06:03-12:59:57 utm httpproxy[6078]: id="0002" severity="info" sys="SecureWeb" sub="http" name="web request blocked" action="block" method="CONNECT" srcip="10.xx.xx.xx" dstip="" user="" group="" ad_domain="" statuscode="502" cached="0" profile="REF_HttProContaInterNetwo12 (Profile - eReaders)" filteraction="REF_HttCffFilteEread (Filter - eReaders)" size="0" request="0xde4d1600" url="https://s3.amazonaws.com/" referer="" error="Host not found" authtime="0" dnstime="7" cattime="299" avscantime="0" fullreqtime="321950" device="0" auth="0" ua="" exceptions="" overridereputation="1" category="177" reputation="trusted" categoryname="Content Server"
I recently (sometime within the past week) updated to version 9.500-9. In addition, I created a number of additional Web Protection Policies and Filter Actions yesterday. However, it was running reasonably well with the new policies and actions for most of the day yesterday.
I've rebooted several times today and for the first couple of minutes the UTM is usable, but then it deteriorates and becomes unresponsive.
This thread was automatically locked due to age.

