Important note about SSL VPN compatibility for 20.0 MR1 with EoL SFOS versions and UTM9 OS. Learn more in the release notes.

This discussion has been locked.
You can no longer post new replies to this discussion. If you have a question you can start a new discussion

Calculating throughput according to Interface graph.

I wonder if some one can help with this as im getting super confused as this may be a very noob question .

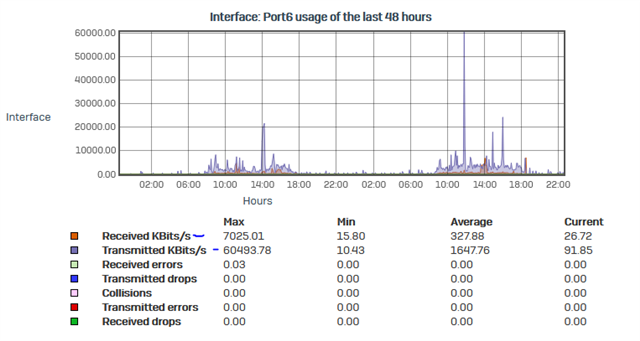
Screen shot below shows in :

KBits/s  - Because its capital KB does that not make it into Kilobytes ?

I'm trying to work out what below Max would be in Mbps


This thread was automatically locked due to age.
Parents Reply Children
  • Thanks for the reply , It kinda doesn't make sense .

    As if you work out the Mbps then its only Received 7Mbps Send 60Mbps (this one a little more believe able ). Which I highly doubt.

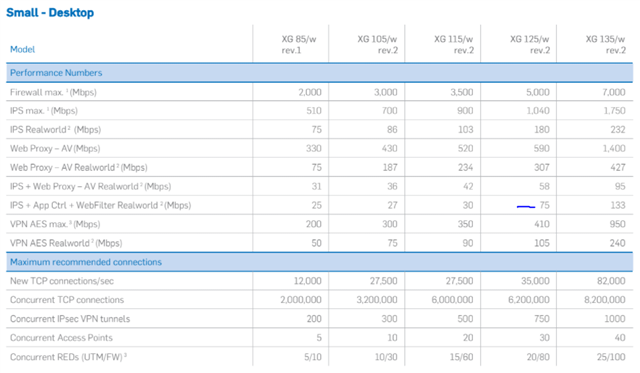
    But then trying to see the average throughput graph and trying to convert it to the correct Mbps - To determine the correct Sophos XG firewall to purchase according to the throughput of the sizing chart it would mean :

    XG125  model would be fine for Web protection ect :

    But if you calculate it according to the method they use on the data sheet , It points to a 2100-3100.

    Maybe im missing something ?

  • On my home unit I have a 50/20 mb/s link which in reality is a 54/18.5 (7/2.1 MB/s approx). The XG under load shows those values for sustained throughput. 

    Also, treat the graphs from the XG with a large grain of salt once you start looking at reports of anything over 2 hours.

    Your sizing really depends on the number of concurrent users rather than actual link performance.

    What speed link are you planning on connecting to it?

    Finally, the graphs are the reverse of what you think, the send is that the XG is sending if it is an internal link.

    Ian

    XG115W - v20.0.2 MR-2 - Home

    XG on VM 8 - v21 GA

    If a post solves your question please use the 'Verify Answer' button.