This discussion has been locked.
You can no longer post new replies to this discussion. If you have a question you can start a new discussion

Postgres process - high CPU load

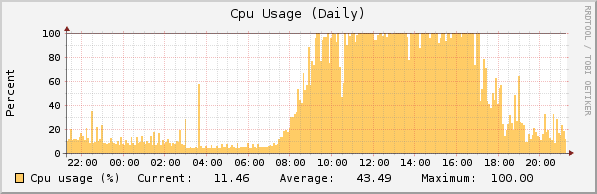
After upgrading ASG120 to 8.201 (now latest 8.202) CPU usage by process postgres increased very dramatically up to 90-100% in peak time. 
I disabled Executive Reporting, but no success.
RAM is 1GB (40-50% used)

What else should I try?


This thread was automatically locked due to age.
  • Try a reboot.

    Cheers - Bob
     
    Sophos UTM Community Moderator
    Sophos Certified Architect - UTM
    Sophos Certified Engineer - XG
    Gold Solution Partner since 2005
    MediaSoft, Inc. USA
  • Just disabling executive report doesn't change anything on the database side. You will have to go under reporting-> settings and disable the reports that you don't need and also decrease the retention time and see if that helps.

    -Bill
  • I rebooted ASG. For better illustration I added daily CPU usage graph.
    If I run top command from console, when postgres process is running for few seconds it can take up to 97% of CPU, during the working hours its takes much longer time and overloading CPU.
  • I reduced the retention time to 1day, CPU load is still very hi ~80%.
    I have 4 check boxes selected: Accounting, Authentication, Firewall and IPS.
    When I unchecked Accounting problem was solved and CPU load is around 5%.
    Why this happening? With 1 day retention time I can only generate daily executive reports?
    What is generated under Accounting reporting, there is no description in manual?
    I have ASG320 running without any problems with all retention check boxes selected for 6month.
  • My guess is that you have one or more broken PostgreSQL database(s).  If you have Astaro Support on the 120, you should ask your reseller to submit a support request.

    If you don't have support, or, if you don't mind losing your history (reporting and logs), you could copy an unencrypted configuration backup into the root directory of a USB memory stick, do a factory reset and reboot the 120 with the USB memory stick inserted.

    Cheers - Bob
     
    Sophos UTM Community Moderator
    Sophos Certified Architect - UTM
    Sophos Certified Engineer - XG
    Gold Solution Partner since 2005
    MediaSoft, Inc. USA
  • I have Astaro Support on the 120, but it is good chance to try recovery procedure [:)] Thanks a lot guys!
  • I did a few things to fix the CPU usage. When I logged into the Shell, and ran 'top' I noticed that postgresql was consuming a good majority of CPU. So, doing a lot of research, I noticed that when I disabled "Web Security" on the reporting settings, the CPU spikes subsided. But this is unacceptable, as it needs to be enabled in order to receive the filtering reports on the Executive report (one of the reasons we went with the ASG220 was for the reporting). Anyway, the CPU was spiking to 60-80% and staying there for 6-8 minutes, and it'd drop for only a few minutes and back at it again. Looked like a fine toothed comb on the CPU usage chart. Anyway, I also noticed the RAM sitting at about 24% and the swap sitting at 10%.

      So my first order was to try to reduce disk I/O. As root in the shell, I executed 'sysctl -w vm.swappiness=10'. After which, I executed 'swapoff -a', followed by 'swapon -a'. Which effectively flushed the swap. My memory usage increased, but this should help extend the disk life too. It wasn't the CPU usage solution, but did ease my mind some. I don't like to swap to disk if the memory is available. (Edit: The original swappiness was set at the Linux default of 60).

      Anyway, next course, I edited the postgres config file located at /var/storage/pgsql/data/postgresql.conf, and at the bottom of the file, I added the line 'effective_cache_size = 192MB'. Now on my ASG220, 192MB is approximately 10% of the total system memory, you may want to adjust this down if your memory is less. But I saved the file, and restarted Postgresql (/etc/init.d/postgresql restart). It spiked for the initial startup, but after which, I've not seen a spike yet. I've even re-enabled Web Security, and even set the reporting detail level back to "3 levels of URL" and no spikes! AWESOME! Perhaps Astaro/Sophos can roll this out as a permanent patch. It The swappiness isn't necessary, but the effective cache size seems to be the fix. We have the ASG220 v8.301 with 4 multi-pathed internet connections totalling >70Mbps in inbound bandwidth.

    I'm a happy camper again! Woot!

    Matt
    IT Operations
  • Hi, Matt, and welcome to the User BB!

    Normally, users with support should not change anything from the command line as that can void the support contract.  There's been a lot of discussion here about swappiness, and I think most of us have been brought around to the belief that the developers know what they're doing with that.  You may have found something with that cache setting though, but I have to admit to almost-total ignorance about the internals of PostgreSQL.

    I'm not seeing this problem at any of my clients.  Did you check the Selfmonitoring and System messages logs to confirm that you don't have a broken PostgreSQL table?  If so, then it would seem that you've made a great discovery and that a developer would be interested in your idea.

    Cheers - Bob
     
    Sophos UTM Community Moderator
    Sophos Certified Architect - UTM
    Sophos Certified Engineer - XG
    Gold Solution Partner since 2005
    MediaSoft, Inc. USA
  • Thanks! When I applied the PGSQL fix, I was excited to help anyone out there with the issue. We have near 50 employees working on the internet here, and that has a great deal to do with the high volume of reporting. Any time the system hits disk, you'll run into a bottleneck. Especially when it involves database activity.

    I'd imagine that with the Swappiness, it may be just a matter of "there are bigger fish to fry" with the engineers, and they don't have the time to look into such a petty matter. Also, as with that, the more features you enable, like IPS, etc, the more physical memory is used. If you're already close to the physical memory being maxed out, then changing the swappiness may be a bad idea. But in my instance, I'm not even using 50% even with the swappiness change (see attached Mem Usage graph). 

    As far as the PostgreSQL, there were no indications of any database corruption. We had engineers galore looking at it and the only thing they could say is to disable Web Security reporting. Turning the detail level down didn't help much. You can see my CPU usage history now (attached). The spikes on the left are while I was working on discovering the issue. You can see once I applied the effective cache size, that the spikes subsided. We have near 50 users, and all are on the internet, as we are a web-based company. I've re-enabled all needed options in reporting with little to no jump in CPU. Quite an awesome feeling! The "Known Issues" say it's fixed in 8.303, but 8.303 isn't out yet (that I can see, my ASG220 is at 8.301, up2date is on, no updates waiting to apply).  (Edit: My Web Security detail level is now 4, btw).

    ID19968 8.300 postgres causes high load due to the default websecurity detail level 4
    ------------------------------------------------------------------------
    Description:  On some ASGs the postgres database may cause a highload.
    Workaround:   The default websecurity detail level (4) is not usable for
                  some installations.
                  Please reduce the websecurity detail level to (0)
                  (Webadmin: Reporting settings).
    Fixed in:     8.303


    Best Regards,
    Matt
    IT Operations - Woodland Direct
  • Hi Matt,

    ... I added the line 'effective_cache_size = 192MB' ...  and restarted Postgresql (/etc/init.d/postgresql restart). ...


    chances are that the restart of Postgres fixed your problem, not the line you added to the config. Up to Version 8.910 the postgres autovacuum analyzer runs only after about 20% of a table have been changed (inserted/updated/deleted). We found out that this  threshold is way to high and might give the query planner statistics which are of by several orders of magnitude for "today" querys (which are - unfortunately - the most common querys), resulting in quite bad query execution and really low performance.

    This issue is tracked as Mantis ID #20713 and has been fixed with the last beta release (UTM-V9 8.920).

    Cheers,
    Kai