

Disclaimer: This information is provided as-is for the benefit of the Community. Please contact Sophos Professional Services if you require assistance with your specific environment.
Table Of Contents:
- Overview:
- Scenario
- Understanding “top” Command:
- TOP Command Shortcuts:
- Understanding “atop” Command:
- ATOP Command Shortcuts:
- Additional Info from KB Sophos Firewall: Check the CPU usage using top
- Checking the CPU usage on your Sophos series Firewall
Overview:
This recommended read describes the usage of the commands “top” and “atop,” which are used for resource monitoring, checking processor and memory usage, disk utilization, and other resource usage history.
Scenario
When the Sophos Firewall is spiking up the CPU/Memory usage, we need to isolate the services responsible for high resource consumption. In such scenarios, these commands would come in handy.
Understanding “top” Command:
The top (table of processes) is a task manager program that shows a real-time view of running processes and displays kernel-managed tasks. The command also provides a system information summary that shows resource utilization, including CPU and memory usage.
Command: top
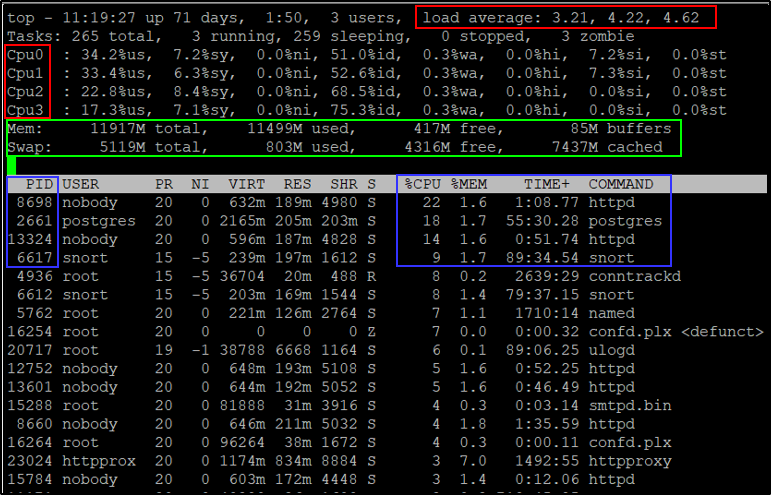
Note: The above screenshot shows the individual CPUs (Pressed 1)
As soon as you’ll run this command, it’ll open an interactive command mode where the top half portion will contain the statistics of processes and resource usage. The lower half contains a list of the currently running processes.
Analysis of top output:
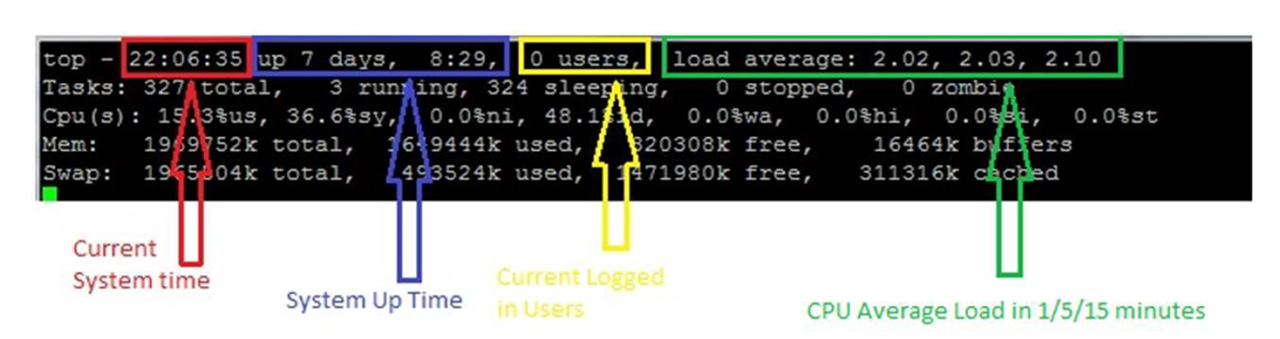
The below result shows the system's uptime from the last reboot, currently logged-in users, and CPU load on the firewall.
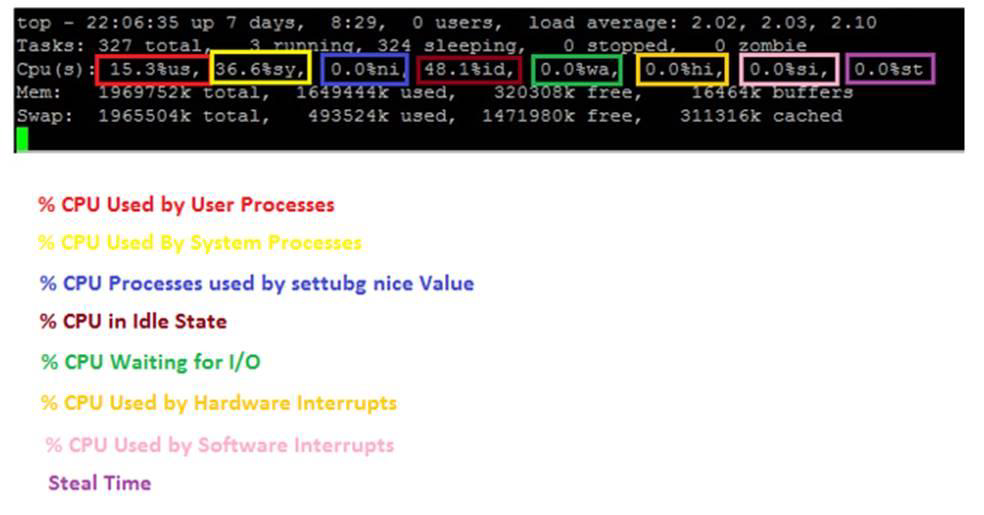
You can find out all the details related to your CPU utilization in real time, as seen in the screenshot below:
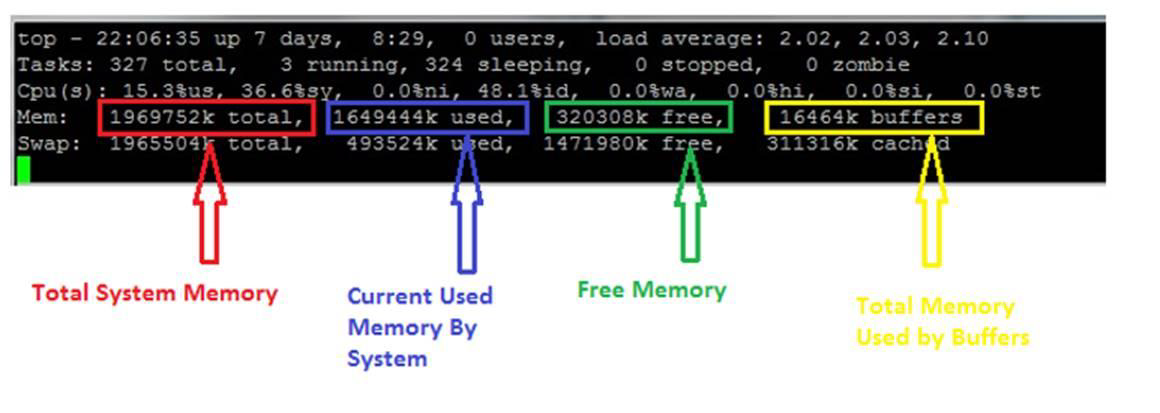
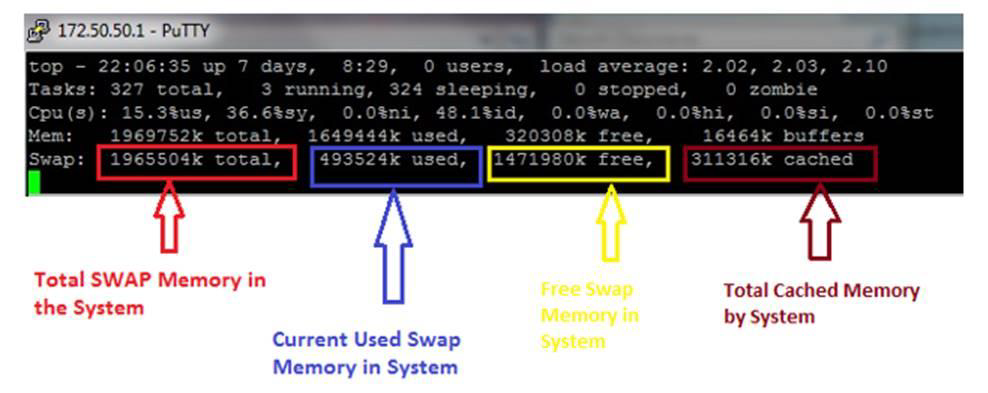
To understand the memory allocation on the firewall, we need to review the below string, as this bifurcates the memory usage in all relevant categories.
Note: This is the total CPU available (averaging CPUs in a multi- CPU system).
Similarly, we can see the swap memory outcomes as well.
What is SWAP memory?
SWAP memory is the dedicated amount of hard drive used whenever the system runs out of RAM. There’s a memory management program in a device that takes care of this process. Whenever the RAM is short, the memory management program looks for all those inactive blocks of data present in RAM that haven’t been used for a long time. When it successfully finds those blocks, it shifts them into the swap memory. In this way, the space in the RAM is freed up, and so, it can be utilized for some other programs that need processing on an urgent basis.
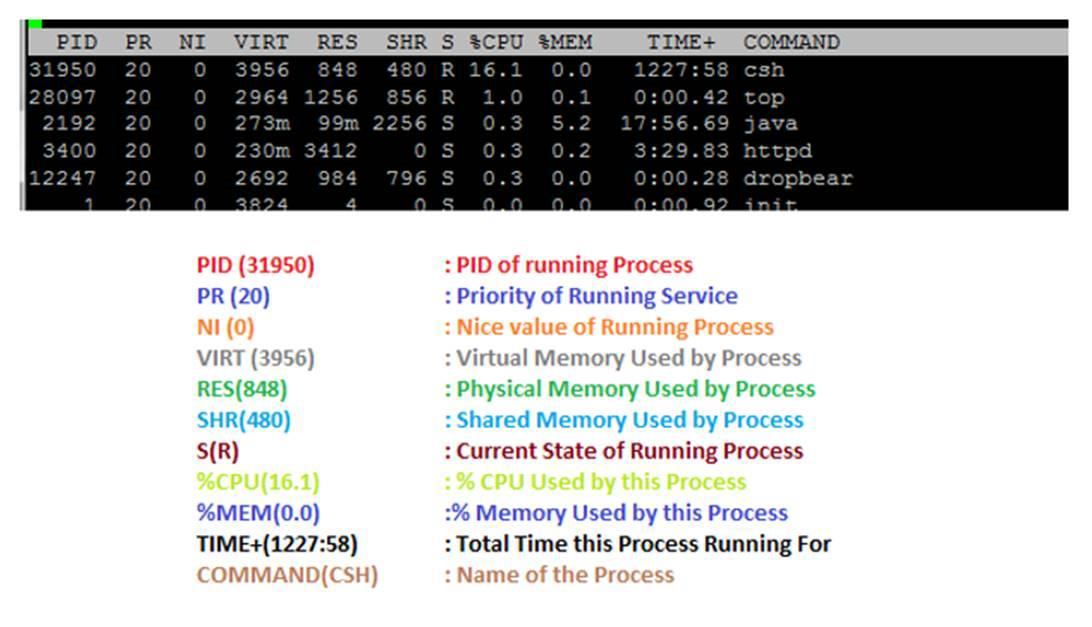
To isolate the services consuming high resources and review their utilization specifications, please refer to the output below.
TOP Command Shortcuts:
|
Shortcut Key |
Explanation |
| I |
To display or to hide load average line |
|
T |
To display or to hide task/CPU line |
|
1 |
To display or hide all other CPU |
|
M |
To display or to hide RAM and SWAP details |
|
R |
To sort by PID number |
|
P |
To sort by CPU utilization |
|
M |
To sort by RAM utilization |
|
K |
To kill a process, press k then PID number then enter to kill a process |
|
Q |
To quit the top command |
|
h |
For getting help on top command |
The top output keeps refreshing until you press ‘q‘. With the below command, the top command will automatically exit after 10 repetitions.
# top -n 10
Also, you can save the output using the below command:
# top -n 1 -b > /var/top-output.txt
Understanding “atop” Command:
atop is a Linux process monitor tool that is similar to the top but provides more detailed information about the system status, as well as the ability to save its output to a file periodically so that the resource utilization of the system can be recorded and retrieved at a later time (for example, so that you can monitor utilization during rare or intermittent events without having to actively wait for them to occur).
Command: atop
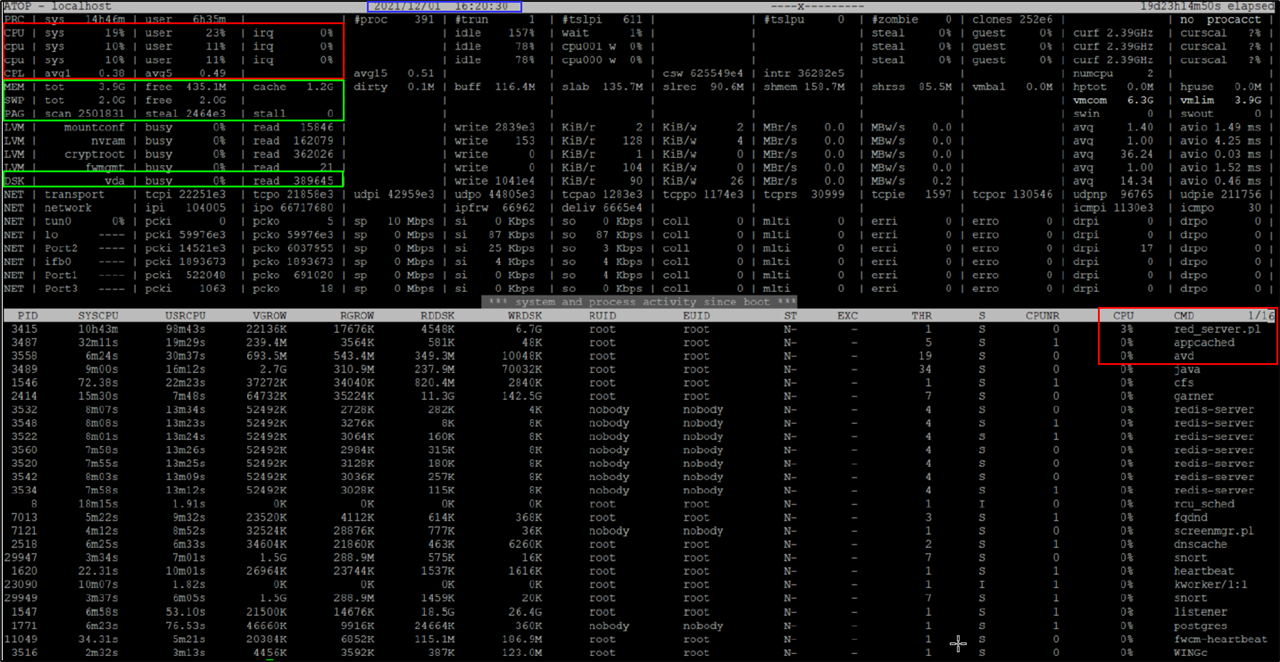
Note: This screenshot is from Irix mode, showing the usage of a single CPU (E.g., 50% listed here on a four-CPU system means 12.5% of the total CPU is being used.
ATOP Command Shortcuts:
|
Shortcut Key |
Explanation |
|
a |
Sort in order of most active resources. |
|
c |
Revert to sorting by CPU consumption (default). |
|
d |
Sort in order of disk activity. |
|
m |
Sort in order of memory usage. |
|
n |
Sort in order of network activity. |
Additional Info from KB Sophos Firewall: Check the CPU usage using top
To understand real CPU usage in a multi-CPU system like the Sophos Firewall, you can't use the default top settings.top will sum up the CPU usage across all threads within a process on all the CPUs. In the default view, if the sum is greater than 100%, then it will display 99.9%. But a four-cpu system can handle up to 400% usage of a single CPU.
If a process shows 99.9%, it means it’s taking something more than 100% of one CPU on a multiple-CPU system. That does not indicate there’s a problem, as it may be a fraction of the total available CPU on a multi-CPU system.
To get more meaningful numbers, follow the steps below.
Checking the CPU usage on your Sophos series Firewall
- Open your Sophos Firewall CLI.
- Go to Device Management.
- Go to Advanced Shell.
- Run the command:
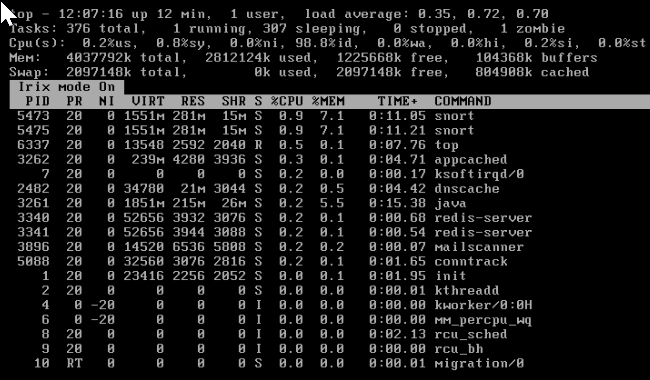
top - Press I (i in caps). This will turn Irix mode off and switch you to Solaris mode.

- Now, the percentage displayed will be the percentage of all available CPU power. In this mode, everything is scaled, so the total CPU is available. This is similar to what is displayed in Webadmin > Diagnostics > System graphs > CPU usage. If a process is taking a large amount of CPU in this mode, it could be a concern.
- Press I again, and it will say "Irix mode on." This will now display in Irix mode without the 99% limit.
Note: Press 1 at the top to get a summary of the usage of each CPU.
- To exit, press q, then enter exit.
- You can find out the number of CPUs on a system by running the command:
grep -c "^processor" /proc/cpuinfo
For example, Assume an eight-CPU system where the total CPU usage of snort threads is roughly two CPUs.
top (default): 99.9 % snort
top (Solaris mode): 25% snort
top (Irix mode): 200% snort
Note: Even though it starts with Irix mode on, the CPU usage for processes is misleading because it’s limited to 99.9%. It would be best to toggle it repeatedly to get an accurate number.
Related Information:
https://logic.edchen.org/irix-mode-vs-solaris-mode-in-top-command/
Revamped RR
[edited by: Erick Jan at 1:51 PM (GMT -7) on 17 Sep 2024]