

Disclaimer: This information is provided as-is for the benefit of the Community. Please contact Sophos Professional Services if you require assistance with your specific environment.
Hi Community,
This article describes the Data Transfer Traffic usage difference between the WAN Link Manager and the WAN Zone report.
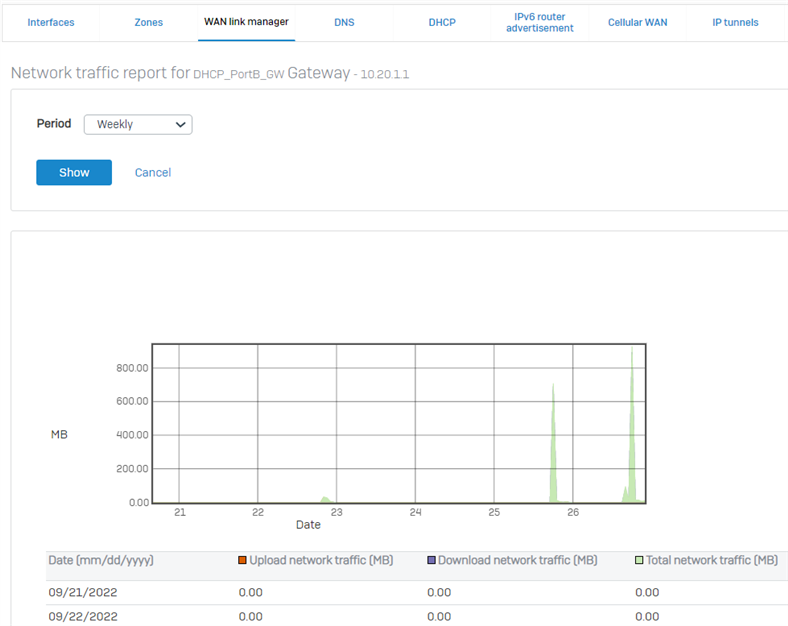
Go to Network > WAN Link Manager and click the Manage icon next to the IPv4 or IPv6 Gateway to view data transfer graphs related to that Gateway.
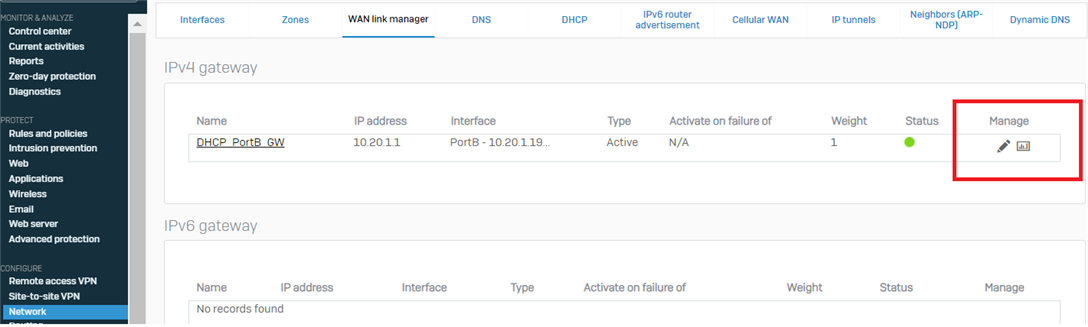
These graphs give an insight into the volume of traffic passing through the selected gateway in terms of upload and download network traffic (in MB).
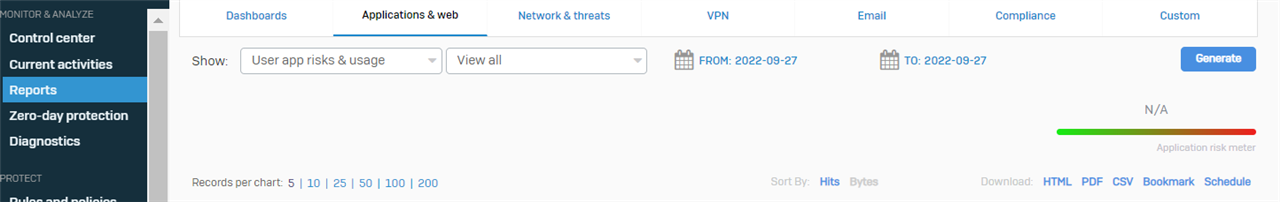
WAN Zone reports are generated under Monitor & Analyze >Reports> Application & Web > User App risks & Usage.
Data Transfer Usages in WAN Link Manager shows Layer 1/ Physical level stats and can be compared against ISP data transfer.
WAN Zone is the logical entity that works at Layer 3. Based on the traffic passed from a specific firewall rule, the WAN zone graph is generated from the connection.
Below are the statistics of WAN Link, Manager, and WAN Zone reports explaining the reason for different Data Transfer traffic usages.
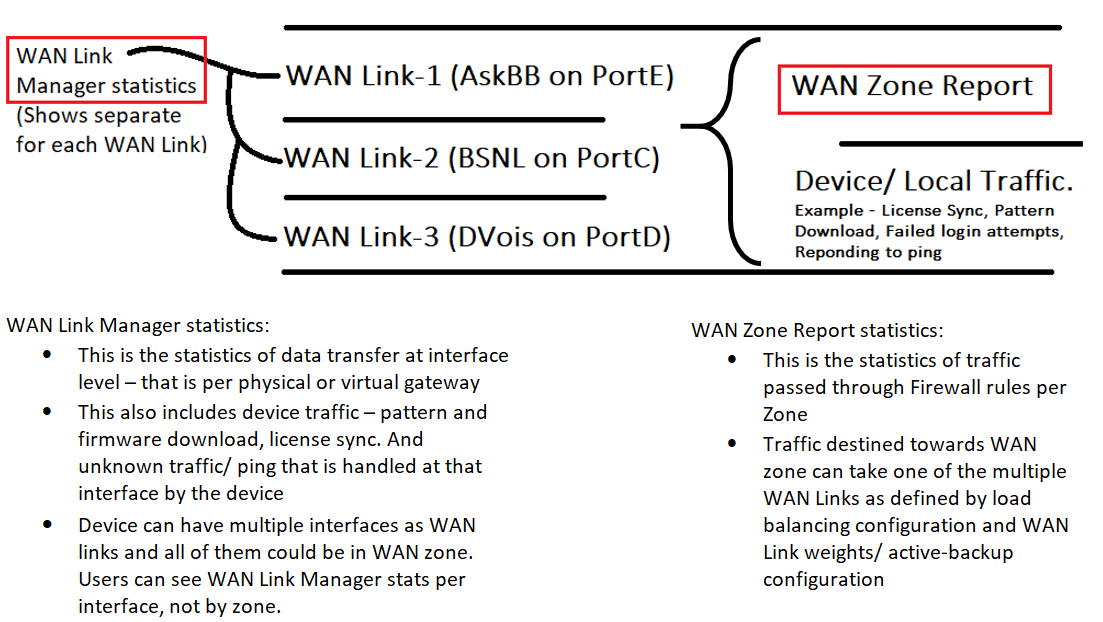
WAN Link Manager statistics:
- This is the statistics of data transfer at the interface level – that is, per physical or virtual gateway
- This also includes device traffic – patterns and firmware download license sync. And unknown traffic/ ping that is handled at that interface by the device
- The device can have multiple interfaces as WAN links; all could be in the WAN zone. Users can see WAN Link Manager stats per interface, not by zone.
WAN Zone Report statistics:
- This is the statistics of traffic passed through Firewall rules per Zone
- Traffic destined towards the WAN zone can take one of the multiple WAN Links as defined by load balancing configuration and WAN Link weights/ active-backup configuration.
The below logical diagram would also explain the difference between WAN Link Manager and WAN Zone reports.
Horizontal Lines, Grammar
[edited by: emmosophos at 10:30 PM (GMT -8) on 21 Nov 2023]