

Hello everyone!
Since yesterday 00:35 UTC the CPU utilization on my Sophos UTM is continuously on 100%
The Sophos runs on a virtual machine with 8GB memory and 2 cores with 3.80GHz.
After restarting the firewall, it is at 50% CPU for some time, until it jumps up again to 100% and stays there.
I did not change any setting immediately prior to this problem coming up.
I sshd into the machine to see what processes are running and found the following with `ps auxf`
root     12205  0.0  0.0   4464   612 ?        S    01:55   0:00  \_ /usr/sbin/cron
root     12237  0.0  0.1  15764 10168 ?        Ss   01:55   0:07  |   \_ /usr/local/bin/create_rrd_graphs.plx --mode daily
root     12253  7.5  0.0  13148  4820 ?        R    01:55  72:28  |       \_ /usr/bin/rrdtool graph /var/log/reporting/images/cpuusage_daily.png_tmp --imgformat=PNG --alt-y-grid --rigid --lower-limit=0 --height=120 --width=500 --start -1d --title Cpu Usage (Daily) --x-grid MINUTE:30:HOUR:2:HOUR:2:0:%R --verti
r
cron seems to start rrdtool processes, which seem to be stuck. and it will start more and more of the processes over time.
Things I have tried:
- I have tried to kill the rrdtool processes but they just respawn.
- I have tried to remove all cached results because I thought that less data might make it easier for the process
- I have setup a new VM with a fresh install of the firewall where I restored my config
Here also a picture of my Hardware Reporting: (Around 19:00 yesterday was when I tried the new VM instance)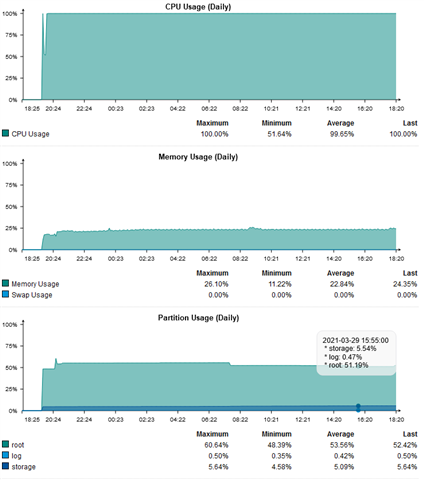
Please let me know what logs I can supply to help you understand my problem :)
This thread was automatically locked due to age.
