This discussion has been locked.
You can no longer post new replies to this discussion. If you have a question you can start a new discussion

Issue in the SDWAN routing engine

Hi,

I'm experiencing a strange issue with the SDWAN routing engine. I have 2 Sophos XG connected via route-based ipsec (xfrm interfaces) and using SDWAN rules for the routing decision.

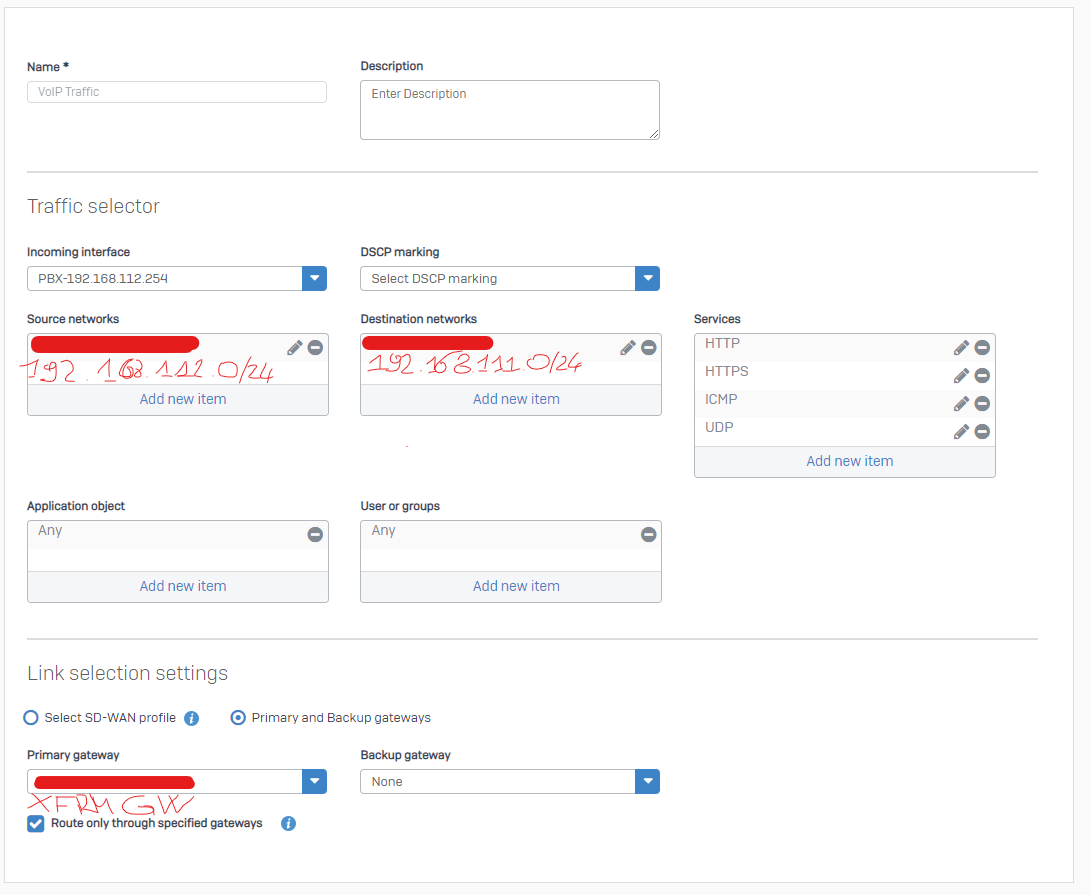
The XG located at the branch office route traffic, using a SDWAN rule, from the subnet 192.168.112.0/24 to 192.168.111.0/24.

In the SDWAN rule I'm using the "Route only through specified gateways" options.

As you can see the traffic incoming is routed via xfrm6 interface.

But sometimes the packets are not routed correctly. Instead of going out through the xfrm tunnel they are routed to the PPPoE interface. 

 Disable, and re-enable, the SDWAN rule fix the issue, at least temporarily.

I'm not able to determine the root cause of the issue. Any ideas?

Thanks


This thread was automatically locked due to age.
Parents
  • Could you show us your SD-WAN rule? 

    __________________________________________________________________________________________________________________

  • Of course!

    The rule target the VoIP traffic (SIP and RTP) and the WebRTC. I remove the labels because the naming convention would mean anything to you.

  • Here the output:

    conntrack -L | grep 192.168.112.15
    proto=udp proto-no=17 timeout=149 orig-src=192.168.111.250 orig-dst=192.168.112.15 orig-sport=5060 orig-dport=5060 packets=6699 bytes=3223555 reply-src=192.168.112.15 reply-dst=192.168.111.250 reply-sport=5060 reply-dport=5060 packets=17398 bytes=9730930 [ASSURED] mark=0x0 use=1 id=1166308911 masterid=0 devin=xfrm6 devout=Port1.11 nseid=0 ips=0 sslvpnid=0 webfltid=0 appfltid=0 icapid=0 policytype=1 fwid=11 natid=0 fw_action=1 bwid=0 appid=38 appcatid=11 hbappid=0 hbappcatid=0 dpioffload=0x3f sigoffload=0 inzone=5 outzone=8 devinindex=32 devoutindex=24 hb_src=0 hb_dst=0 flags0=0xa0000200000 flags1=0x4012002800000 flagvalues=21,41,43,87,89,101,104,114 catid=0 user=0 luserid=0 usergp=0 hotspotuserid=0 hotspotid=0 dst_mac=45:60:01:d2:af:db src_mac=40:00:3f:11:28:85 startstamp=1673877154 microflow[0]=INVALID microflowid[1]=350 microflowrev[1]=7 hostrev[0]=0 hostrev[1]=65 ipspid=0 diffserv=0 loindex=24 tlsruleid=0 ips_nfqueue=0 sess_verdict=2 gwoff=0 cluster_node=0 current_state[0]=3527 current_state[1]=3527 vlan_id=0 inmark=0x0 brinindex=0 sessionid=1824 sessionidrev=25973 session_update_rev=6 dnat_done=0 upclass=0:0 dnclass=0:0 pbrid[0]=0 pbrid[1]=1 profileid[0]=0 profileid[1]=0 nhop_id[0]=17 nhop_id[1]=65535 nhop_rev[0]=0 nhop_rev[1]=0 saidx[0]=0 saidx[1]=0 saidx_rev[0]=0 saidx_rev[1]=0 atomic_flags=0x0 conn_fp_id=NOT_OFFLOADED

  • It is odd to me, your primary route is 0. The backup route is 1. Do you have other SD-WAN routes in place? 

    __________________________________________________________________________________________________________________

  • Yes, I have multiple xfrm gateways.

    The Sophos XG have 2 WAN interface. On these 2 WAN I've got 4 xfrm interface (4 tunnel IPSEC, two for each WAN), but the SDWAN in question target a specific gateway, for this reason I check the "Route only through specified gateways".

    When the traffic is routed correctly this is the conntrack:

    conntrack -L | grep 192.168.112.15
    proto=udp proto-no=17 timeout=149 orig-src=192.168.111.250 orig-dst=192.168.112.15 orig-sport=5060 orig-dport=5060 packets=6699 bytes=3223555 reply-src=192.168.112.15 reply-dst=192.168.111.250 reply-sport=5060 reply-dport=5060 packets=17398 bytes=9730930 [ASSURED] mark=0x0 use=1 id=1166308911 masterid=0 devin=xfrm6 devout=Port1.11 nseid=0 ips=0 sslvpnid=0 webfltid=0 appfltid=0 icapid=0 policytype=1 fwid=11 natid=0 fw_action=1 bwid=0 appid=38 appcatid=11 hbappid=0 hbappcatid=0 dpioffload=0x3f sigoffload=0 inzone=5 outzone=8 devinindex=32 devoutindex=24 hb_src=0 hb_dst=0 flags0=0xa0000200000 flags1=0x4012002800000 flagvalues=21,41,43,87,89,101,104,114 catid=0 user=0 luserid=0 usergp=0 hotspotuserid=0 hotspotid=0 dst_mac=45:60:01:d2:af:db src_mac=40:00:3f:11:28:85 startstamp=1673877154 microflow[0]=INVALID microflowid[1]=350 microflowrev[1]=7 hostrev[0]=0 hostrev[1]=65 ipspid=0 diffserv=0 loindex=24 tlsruleid=0 ips_nfqueue=0 sess_verdict=2 gwoff=0 cluster_node=0 current_state[0]=3527 current_state[1]=3527 vlan_id=0 inmark=0x0 brinindex=0 sessionid=1824 sessionidrev=25973 session_update_rev=6 dnat_done=0 upclass=0:0 dnclass=0:0 pbrid[0]=0 pbrid[1]=1 profileid[0]=0 profileid[1]=0 nhop_id[0]=17 nhop_id[1]=65535 nhop_rev[0]=0 nhop_rev[1]=0 saidx[0]=0 saidx[1]=0 saidx_rev[0]=0 saidx_rev[1]=0 atomic_flags=0x0 conn_fp_id=NOT_OFFLOADED

  • Hi, i did actually misinterpret your outprint. 

    pbrid0= means the source and destination network have a matching SD-WAN rule. 

    pbrid1= means, the reply traffic have a matching sd-wan rule, if you would split traffic.

    This means, the firewall cannot find a matching rule for this traffic. 

    And that is correct: 

    orig-src=192.168.111.250 orig-dst=192.168.112.154

    Does not match: 

    __________________________________________________________________________________________________________________

  • Hi,

    thanks for your reply!

    If I understand correctly pbrid[1]=1 means that reply traffic matches an sd-wan rule.

    In my case the Sophos XG in the branch office sends traffic from 192.168.112.0/24 to 192.168.111.0/24 (as you can see in the screenshot), but I don't have any other sd-wan rules that match traffic from 192.168.111.0/24 to 192.168.112.0/24.

  • Is your network (111.0) directly attached? 

    __________________________________________________________________________________________________________________

  • The HQ XG has the subnet 192.168.111.0/24 directly attached and the branch has 192.168.112.0/24.

    The screenshot of the SDWAN rule I posted earlier was taken from the Branch Office XG. The HQ has a similar rule, the source and the destination is inverted.

    192.168.111.0/24 ----> HQ XG ------ XFRM INTERFACE ------  Branch XG <---- 192.168.112.0/24

  • __________________________________________________________________________________________________________________

  • Did it a few weeks ago, but it didn't solve the issue.

    console> system route_precedence show
    Routing Precedence:
    1. Static routes
    2. SD-WAN policy routes
    3. VPN routes

    Other changes I made are:

    system system_modules sip unload
    set advanced-firewall udp-timeout-stream 30
    set advanced-firewall udp-timeout 30
    set vpn conn-remove-tunnel-up disable
    set vpn conn-remove-on-failover all
    set routing sd-wan-policy-route system-generate-traffic enable
    set routing sd-wan-policy-route reply-packet enable
    set ips sip_preproc disable
  • During the routing issue this is the conntrack on the branch office:

    conntrack -L | grep 192.168.112.15
    proto=udp proto-no=17 timeout=140 orig-src=192.168.111.250 orig-dst=192.168.112.15 orig-sport=5060 orig-dport=5060 packets=2206 bytes=1082257 reply-src=192.168.112.15 reply-dst=192.168.111.250 reply-sport=5060 reply-dport=5060 packets=8388 bytes=4968880 [ASSURED] mark=0x0 use=1 id=4252673975 masterid=0 devin=xfrm6 devout=Port1.11 nseid=0 ips=0 sslvpnid=0 webfltid=0 appfltid=0 icapid=0 policytype=1 fwid=11 natid=0 fw_action=1 bwid=0 appid=38 appcatid=11 hbappid=0 hbappcatid=0 dpioffload=0x3f sigoffload=0 inzone=5 outzone=8 devinindex=32 devoutindex=24 hb_src=0 hb_dst=0 flags0=0xa0000200000 flags1=0x4012002800000 flagvalues=21,41,43,87,89,101,104,114 catid=0 user=0 luserid=0 usergp=0 hotspotuserid=0 hotspotid=0 dst_mac=45:60:01:d2:43:c9 src_mac=40:00:3f:11:94:97 startstamp=1674504812 microflow[0]=INVALID microflowid[1]=477 microflowrev[1]=29 hostrev[0]=0 hostrev[1]=208 ipspid=0 diffserv=0 loindex=24 tlsruleid=0 ips_nfqueue=3 sess_verdict=2 gwoff=0 cluster_node=0 current_state[0]=334 current_state[1]=502 vlan_id=0 inmark=0x0 brinindex=0 sessionid=252 sessionidrev=3304 session_update_rev=6 dnat_done=0 upclass=0:0 dnclass=0:0 pbrid[0]=0 pbrid[1]=1 profileid[0]=0 profileid[1]=0 nhop_id[0]=17 nhop_id[1]=65535 nhop_rev[0]=0 nhop_rev[1]=0 saidx[0]=0 saidx[1]=0 saidx_rev[0]=0 saidx_rev[1]=0 atomic_flags=0x0 conn_fp_id=NOT_OFFLOADED

    The TCPdump running on the HQ XG show no packets incoming from host 192.168.112.15

    Then I delete che connection manually:

    conntrack -D -s 192.168.112.15
    conntrack v1.4.5 (conntrack-tools): 0 flow entries have been deleted.

    conntrack -D -d 192.168.112.15
    proto=udp proto-no=17 timeout=126 orig-src=192.168.111.250 orig-dst=192.168.112.15 orig-sport=5060 orig-dport=5060 packets=2206 bytes=1082257 reply-src=192.168.112.15 reply-dst=192.168.111.250 reply-sport=5060 reply-dport=5060 packets=8465 bytes=5018314 [ASSURED] mark=0x0 use=1 id=4252673975 masterid=0 devin=xfrm6 devout=Port1.11 nseid=0 ips=0 sslvpnid=0 webfltid=0 appfltid=0 icapid=0 policytype=1 fwid=11 natid=0 fw_action=1 bwid=0 appid=38 appcatid=11 hbappid=0 hbappcatid=0 dpioffload=0x3f sigoffload=0 inzone=5 outzone=8 devinindex=32 devoutindex=24 hb_src=0 hb_dst=0 flags0=0xa0000200000 flags1=0x4012002800000 flagvalues=21,41,43,87,89,101,104,114 catid=0 user=0 luserid=0 usergp=0 hotspotuserid=0 hotspotid=0 dst_mac=45:60:01:d2:43:c9 src_mac=40:00:3f:11:94:97 startstamp=1674504812 microflow[0]=INVALID microflowid[1]=635 microflowrev[1]=36 hostrev[0]=0 hostrev[1]=211 ipspid=0 diffserv=0 loindex=24 tlsruleid=0 ips_nfqueue=3 sess_verdict=2 gwoff=0 cluster_node=0 current_state[0]=334 current_state[1]=506 vlan_id=0 inmark=0x0 brinindex=0 sessionid=252 sessionidrev=3304 session_update_rev=6 dnat_done=0 upclass=0:0 dnclass=0:0 pbrid[0]=0 pbrid[1]=1 profileid[0]=0 profileid[1]=0 nhop_id[0]=17 nhop_id[1]=65535 nhop_rev[0]=0 nhop_rev[1]=0 saidx[0]=0 saidx[1]=0 saidx_rev[0]=0 saidx_rev[1]=0 atomic_flags=0x0 conn_fp_id=NOT_OFFLOADED
    conntrack v1.4.5 (conntrack-tools): 1 flow entries have been deleted.

    After the conntrack -D command the SIP connection is correctly reestablished:

    conntrack -L | grep 192.168.112.15
    proto=udp proto-no=17 timeout=127 orig-src=192.168.112.15 orig-dst=192.168.111.250 orig-sport=5060 orig-dport=5060 packets=9 bytes=4927 reply-src=192.168.111.250 reply-dst=192.168.112.15 reply-sport=5060 reply-dport=5060 packets=9 bytes=5029 [ASSURED] mark=0x4006 use=1 id=997720407 masterid=0 devin=Port1.11 devout=xfrm6 nseid=0 ips=0 sslvpnid=0 webfltid=0 appfltid=0 icapid=0 policytype=1 fwid=12 natid=0 fw_action=1 bwid=0 appid=38 appcatid=11 hbappid=0 hbappcatid=0 dpioffload=0x3f sigoffload=0 inzone=8 outzone=5 devinindex=24 devoutindex=32 hb_src=0 hb_dst=0 flags0=0x400a0000200008 flags1=0x12002800000 flagvalues=3,21,41,43,54,87,89,101,104 catid=0 user=0 luserid=0 usergp=0 hotspotuserid=0 hotspotid=0 dst_mac=7c:5a:1c:7d:f4:09 src_mac=80:5e:0c:b2:9d:3d startstamp=1674632874 microflowid[0]=82 microflowrev[0]=37 microflow[1]=INVALID hostrev[0]=3 hostrev[1]=0 ipspid=0 diffserv=0 loindex=32 tlsruleid=0 ips_nfqueue=3 sess_verdict=2 gwoff=0 cluster_node=0 current_state[0]=507 current_state[1]=507 vlan_id=0 inmark=0x0 brinindex=0 sessionid=34 sessionidrev=64992 session_update_rev=6 dnat_done=0 upclass=0:0 dnclass=0:0 pbrid[0]=1 pbrid[1]=0 profileid[0]=0 profileid[1]=0 nhop_id[0]=65535 nhop_id[1]=17 nhop_rev[0]=0 nhop_rev[1]=0 saidx[0]=0 saidx[1]=0 saidx_rev[0]=0 saidx_rev[1]=0 atomic_flags=0x0 conn_fp_id=NOT_OFFLOADED
    conntrack v1.4.5 (conntrack-tools): 496 flow entries have been shown.

Reply
  • During the routing issue this is the conntrack on the branch office:

    conntrack -L | grep 192.168.112.15
    proto=udp proto-no=17 timeout=140 orig-src=192.168.111.250 orig-dst=192.168.112.15 orig-sport=5060 orig-dport=5060 packets=2206 bytes=1082257 reply-src=192.168.112.15 reply-dst=192.168.111.250 reply-sport=5060 reply-dport=5060 packets=8388 bytes=4968880 [ASSURED] mark=0x0 use=1 id=4252673975 masterid=0 devin=xfrm6 devout=Port1.11 nseid=0 ips=0 sslvpnid=0 webfltid=0 appfltid=0 icapid=0 policytype=1 fwid=11 natid=0 fw_action=1 bwid=0 appid=38 appcatid=11 hbappid=0 hbappcatid=0 dpioffload=0x3f sigoffload=0 inzone=5 outzone=8 devinindex=32 devoutindex=24 hb_src=0 hb_dst=0 flags0=0xa0000200000 flags1=0x4012002800000 flagvalues=21,41,43,87,89,101,104,114 catid=0 user=0 luserid=0 usergp=0 hotspotuserid=0 hotspotid=0 dst_mac=45:60:01:d2:43:c9 src_mac=40:00:3f:11:94:97 startstamp=1674504812 microflow[0]=INVALID microflowid[1]=477 microflowrev[1]=29 hostrev[0]=0 hostrev[1]=208 ipspid=0 diffserv=0 loindex=24 tlsruleid=0 ips_nfqueue=3 sess_verdict=2 gwoff=0 cluster_node=0 current_state[0]=334 current_state[1]=502 vlan_id=0 inmark=0x0 brinindex=0 sessionid=252 sessionidrev=3304 session_update_rev=6 dnat_done=0 upclass=0:0 dnclass=0:0 pbrid[0]=0 pbrid[1]=1 profileid[0]=0 profileid[1]=0 nhop_id[0]=17 nhop_id[1]=65535 nhop_rev[0]=0 nhop_rev[1]=0 saidx[0]=0 saidx[1]=0 saidx_rev[0]=0 saidx_rev[1]=0 atomic_flags=0x0 conn_fp_id=NOT_OFFLOADED

    The TCPdump running on the HQ XG show no packets incoming from host 192.168.112.15

    Then I delete che connection manually:

    conntrack -D -s 192.168.112.15
    conntrack v1.4.5 (conntrack-tools): 0 flow entries have been deleted.

    conntrack -D -d 192.168.112.15
    proto=udp proto-no=17 timeout=126 orig-src=192.168.111.250 orig-dst=192.168.112.15 orig-sport=5060 orig-dport=5060 packets=2206 bytes=1082257 reply-src=192.168.112.15 reply-dst=192.168.111.250 reply-sport=5060 reply-dport=5060 packets=8465 bytes=5018314 [ASSURED] mark=0x0 use=1 id=4252673975 masterid=0 devin=xfrm6 devout=Port1.11 nseid=0 ips=0 sslvpnid=0 webfltid=0 appfltid=0 icapid=0 policytype=1 fwid=11 natid=0 fw_action=1 bwid=0 appid=38 appcatid=11 hbappid=0 hbappcatid=0 dpioffload=0x3f sigoffload=0 inzone=5 outzone=8 devinindex=32 devoutindex=24 hb_src=0 hb_dst=0 flags0=0xa0000200000 flags1=0x4012002800000 flagvalues=21,41,43,87,89,101,104,114 catid=0 user=0 luserid=0 usergp=0 hotspotuserid=0 hotspotid=0 dst_mac=45:60:01:d2:43:c9 src_mac=40:00:3f:11:94:97 startstamp=1674504812 microflow[0]=INVALID microflowid[1]=635 microflowrev[1]=36 hostrev[0]=0 hostrev[1]=211 ipspid=0 diffserv=0 loindex=24 tlsruleid=0 ips_nfqueue=3 sess_verdict=2 gwoff=0 cluster_node=0 current_state[0]=334 current_state[1]=506 vlan_id=0 inmark=0x0 brinindex=0 sessionid=252 sessionidrev=3304 session_update_rev=6 dnat_done=0 upclass=0:0 dnclass=0:0 pbrid[0]=0 pbrid[1]=1 profileid[0]=0 profileid[1]=0 nhop_id[0]=17 nhop_id[1]=65535 nhop_rev[0]=0 nhop_rev[1]=0 saidx[0]=0 saidx[1]=0 saidx_rev[0]=0 saidx_rev[1]=0 atomic_flags=0x0 conn_fp_id=NOT_OFFLOADED
    conntrack v1.4.5 (conntrack-tools): 1 flow entries have been deleted.

    After the conntrack -D command the SIP connection is correctly reestablished:

    conntrack -L | grep 192.168.112.15
    proto=udp proto-no=17 timeout=127 orig-src=192.168.112.15 orig-dst=192.168.111.250 orig-sport=5060 orig-dport=5060 packets=9 bytes=4927 reply-src=192.168.111.250 reply-dst=192.168.112.15 reply-sport=5060 reply-dport=5060 packets=9 bytes=5029 [ASSURED] mark=0x4006 use=1 id=997720407 masterid=0 devin=Port1.11 devout=xfrm6 nseid=0 ips=0 sslvpnid=0 webfltid=0 appfltid=0 icapid=0 policytype=1 fwid=12 natid=0 fw_action=1 bwid=0 appid=38 appcatid=11 hbappid=0 hbappcatid=0 dpioffload=0x3f sigoffload=0 inzone=8 outzone=5 devinindex=24 devoutindex=32 hb_src=0 hb_dst=0 flags0=0x400a0000200008 flags1=0x12002800000 flagvalues=3,21,41,43,54,87,89,101,104 catid=0 user=0 luserid=0 usergp=0 hotspotuserid=0 hotspotid=0 dst_mac=7c:5a:1c:7d:f4:09 src_mac=80:5e:0c:b2:9d:3d startstamp=1674632874 microflowid[0]=82 microflowrev[0]=37 microflow[1]=INVALID hostrev[0]=3 hostrev[1]=0 ipspid=0 diffserv=0 loindex=32 tlsruleid=0 ips_nfqueue=3 sess_verdict=2 gwoff=0 cluster_node=0 current_state[0]=507 current_state[1]=507 vlan_id=0 inmark=0x0 brinindex=0 sessionid=34 sessionidrev=64992 session_update_rev=6 dnat_done=0 upclass=0:0 dnclass=0:0 pbrid[0]=1 pbrid[1]=0 profileid[0]=0 profileid[1]=0 nhop_id[0]=65535 nhop_id[1]=17 nhop_rev[0]=0 nhop_rev[1]=0 saidx[0]=0 saidx[1]=0 saidx_rev[0]=0 saidx_rev[1]=0 atomic_flags=0x0 conn_fp_id=NOT_OFFLOADED
    conntrack v1.4.5 (conntrack-tools): 496 flow entries have been shown.

Children