What feature is impacted?
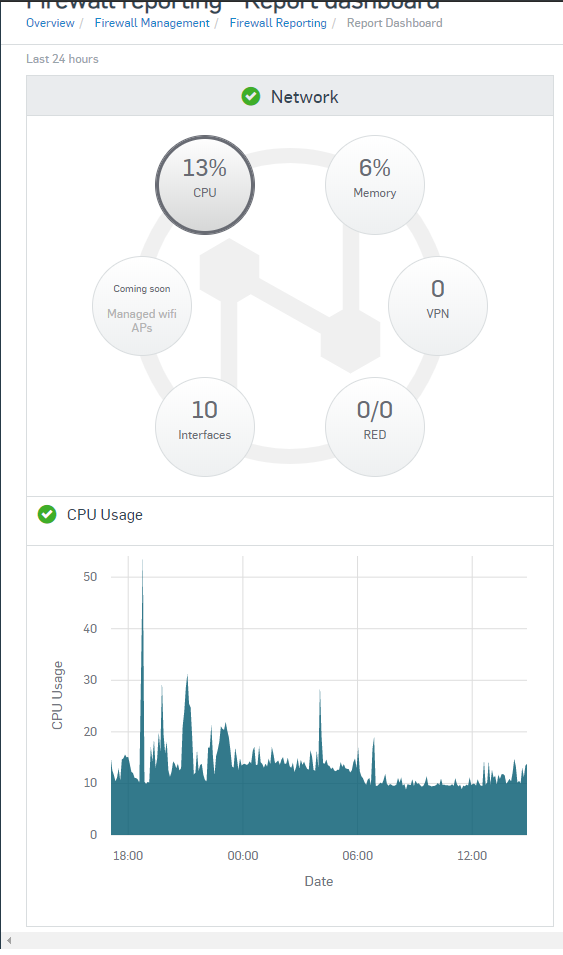
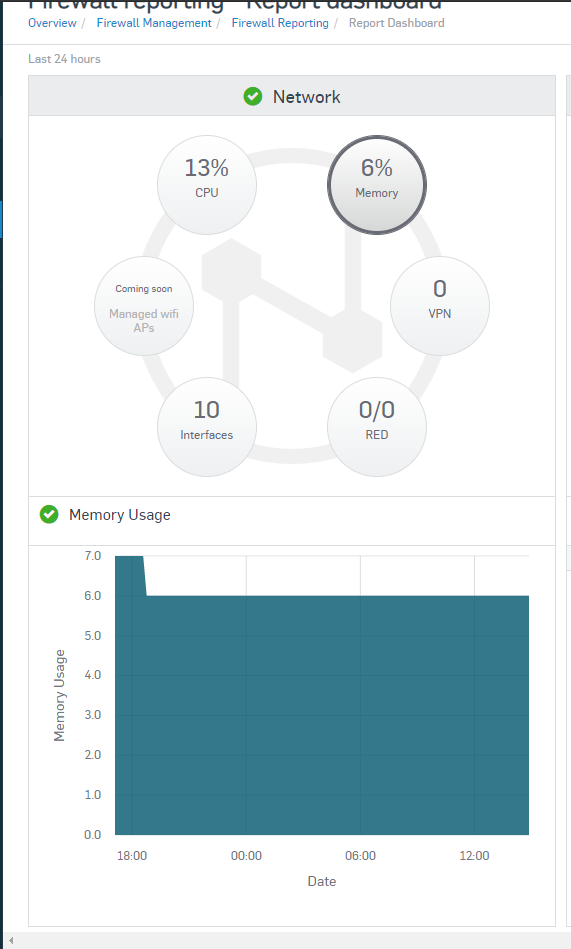
Device Reports - "Last 24 hours Memory" Usage Report Bubble
What is the severity of the issue? (High, medium, low, minimal)
low
Summary of the issues:
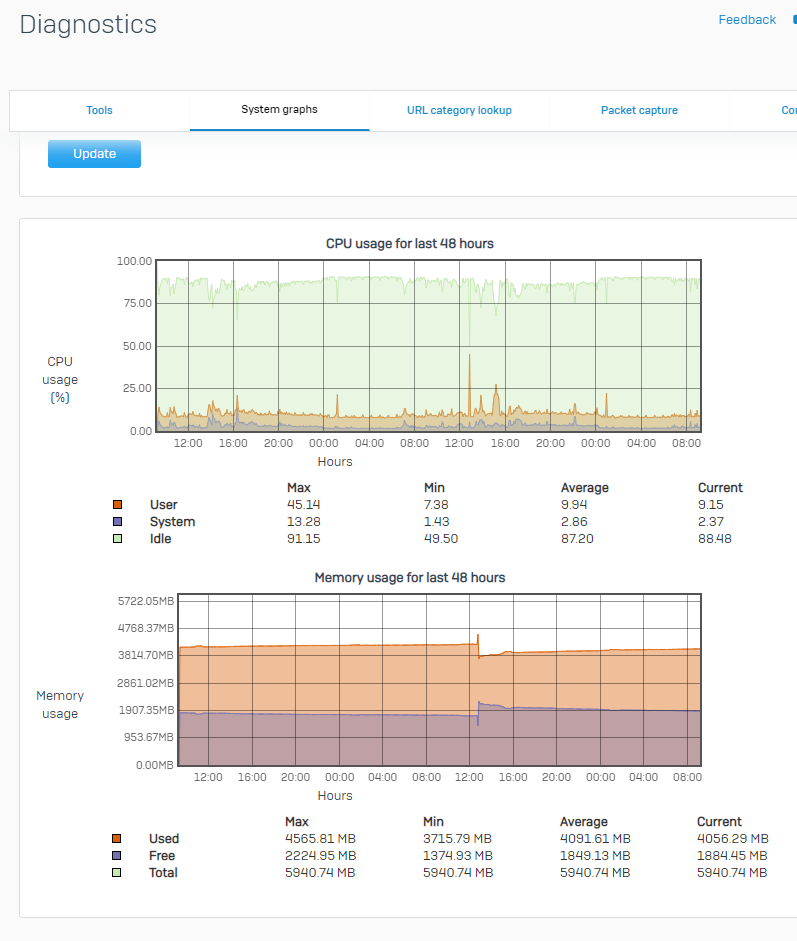
The Memory usage repot percentage is ~factor 10 too low (show 7% instead 70% for my appliance)
Observed behavior (What it did or didn’t do):
-
Desired behavior (How is it expected to or should behave):
show the correct percentage of memory usage
How do we reproduce it (Provide instructions to help us reproduce the behavior):
In the firewall report dashboard in the "Last 24 hours" Network widget memory usage is shown with wrong value.
Same issue if the bubble get checked to enter the full stats, report goes from 0...10 instead 0...100%
Other (Any other detail that we need to know about):
-
Supporting logs, screenshots, video, etc..:
-


