This discussion has been locked.
You can no longer post new replies to this discussion. If you have a question you can start a new discussion

HELP - Reporting no longer working

I'm hoping for some community help! 

I recently transferred my configuration to new(er) hardware and in terms of performance/traffic it's running as expected. This was a clean install of 9.503-4 and my config was imported successfully during the initial wizard. The problem I'm having is that with the exception of my Log Files (todays and archived) I'm getting no reporting. Even the Dashboard Threat Status shows all zeros. The Log Partition Status shows all zeros, and only the 'Hardware' and 'Network Usage' pages show anything in graphs. I've also noticed that I'm no longer getting Executive reports although I do get other alert emails so I know my SMTP settings are correct. I tried to generate an ad hoc Executive Report on my gateway and it just spun without ever completing. 

All of these pretty graphs and things worked on my old platform running the exact same code (though it wasn't a clean install... it was upgraded over time). I've tried rebooting but I'm not sure what else to do, other than possibly rush to install 9.504 but this doesn't seem to be a systemic issue with 9.503. The best matches for similar community posts were from 10+ years ago.

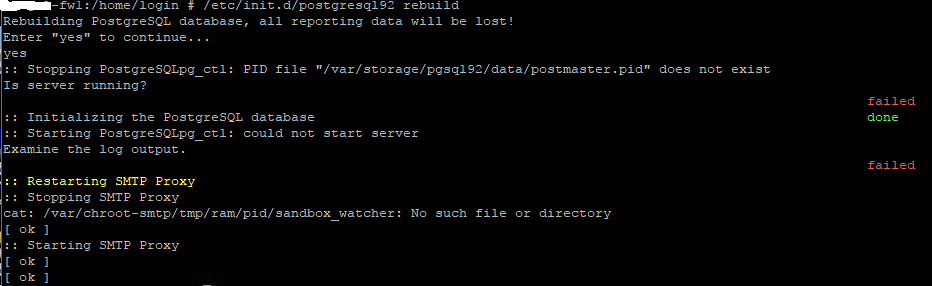
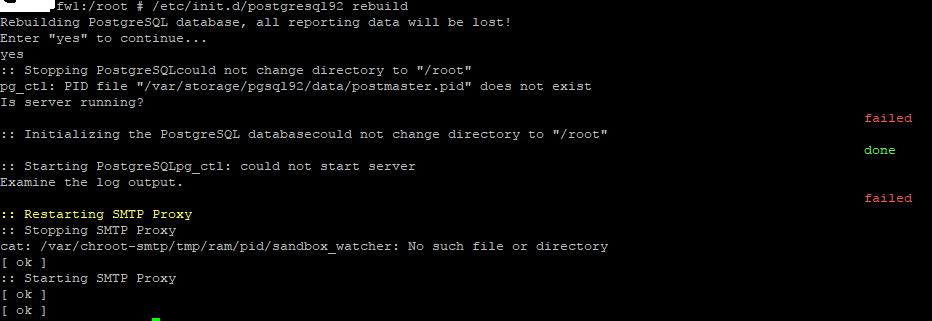
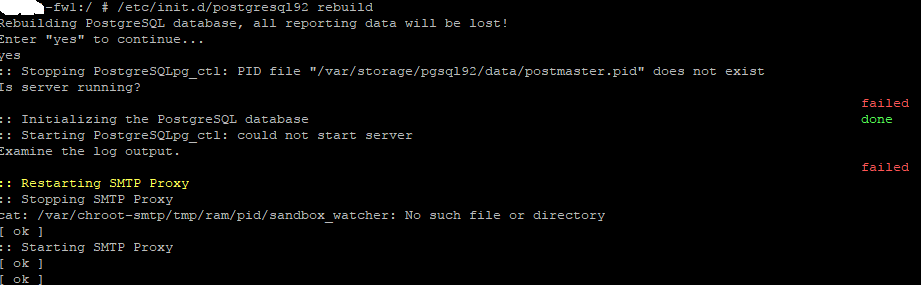
I will say FWIW that I am using remote syslog as well which is working correctly, and that isn't something that was added with this new install. The data is all there, it just doesn't seem to be getting parsed and presented properly. It feels like some sort of DB issue but I have no idea on how to go about troubleshooting/fixing that. I've tried the simple reboot to no avail.

Suggestions?


This thread was automatically locked due to age.
Parents
  • If you have SSH access you can try to rebuild the postgres, this will loose any data in there (but this maybe not odds in your case)


    /etc/init.d/postgresql92 rebuild


    Thanks

    Thanks, Duncan

  • Hmm, I wonder if you're on to something....


    Thoughts on next steps? I really appreciate the help.

  • Please anyone, any other ideas?

    I have now gone as far as a fresh install direct to 9.505 and rebuilding my config from scratch, zero config import. Reporting is once again not working and I have zero clue why or what else to do. This is an OS install direct onto bare metal, no VM involved. I made no modifications via CLI which rules out my tampering, everything I've done has been via the WebUI.

    Next thoughts? Can I manually repair Postgre (I have no idea, that is getting out of my area of expertise and you never know what you can do on a FW image vs Linux)?

  • Matt, you must run the rebuild command as root, not as loginuser.

    Cheers - Bob

     
    Sophos UTM Community Moderator
    Sophos Certified Architect - UTM
    Sophos Certified Engineer - XG
    Gold Solution Partner since 2005
    MediaSoft, Inc. USA
  • Hi Bob,

    I was logged in as root when I executed the command. I'm still getting this when trying to rebuild, restart, or start:

    PID file "/var/storage/pgsql92/data/postmaster.pid" does not exist

    I've found there were release notes in 9.408 specific to this (I'm running a new install on 9.505). I'm also not running in HA/Cluster mode and verified the settings/options are off. For giggles I did try enabling it in Automatic mode to see if it jiggled anything but no dice. I also found an old forum topic noting the same error (https://community.sophos.com/products/unified-threat-management/f/management-networking-logging-and-reporting/34802/root-disk-full-cannot-access-utm-webpage---internal-server-error) but I am definitely not having a disk space issue. 

    So, since I'm not running a cluster, am I even barking up the right tree for my issue? Basically what I'm encountering is, on a brand new install with a new configuration I have no reporting on my UTM. The Live Log files are good but graphs, charts, 'Todays Threat Status' etc shows all zeros or No Data Available.

  • "I was logged in as root when I executed the command."

    That's not what your posts show.  You are logged in as loginuser because you're still in the /home/login directory.  After you login as root, you will be in the /root directory.

    Cheers - Bob

     
    Sophos UTM Community Moderator
    Sophos Certified Architect - UTM
    Sophos Certified Engineer - XG
    Gold Solution Partner since 2005
    MediaSoft, Inc. USA
  • I don't really want to argue about it but my prompt changed from > to # and you get permission denied if you try as loginuser.


    Anyway, I have tried the command 

    /etc/init.d/postgresql92 rebuild

    from /home/login

    from /root

    and /


  • Ahhh, I see, Matt - I didn't look closely enough!

     My best guess is that you're stuck with a reload from ISO.  If this was a recent load fro ISO, you might want to download anew and burn the DVD at 4x or slower.  Let us knw your result.

    Cheers - Bob

     
    Sophos UTM Community Moderator
    Sophos Certified Architect - UTM
    Sophos Certified Engineer - XG
    Gold Solution Partner since 2005
    MediaSoft, Inc. USA
  • Hi,


    would recommend another step before re-image.


    Open two SSH Sessions.

    Execute tailf /var/log/system.log

    And on the other Session /etc/init.d/postgresql92 start


    The System.log Session should link some output regarding the Postgres start up.


    Cheers

    __________________________________________________________________________________________________________________

  • Thanks for the suggestion ManBearPig!

    When I run the tailf I see repeated (every 5 seconds), this:

    ulogd[17060]: pg1: connect: could not connect to server: No such file or directory


    When I execute the Postgres start up I get:

    2017:11:06-10:48:25 ######-fw1 postgres[17204]: [1-1] LOG: loaded library "pg_stat_statements"
    2017:11:06-10:48:25 ######-fw1 postgres[17204]: [2-1] FATAL: could not create shared memory segment: No space left on device
    2017:11:06-10:48:25 ######-fw1 postgres[17204]: [2-2] DETAIL: Failed system call was shmget(key=5432001, size=8829517824, 03600).
    2017:11:06-10:48:25 ######-fw1 postgres[17204]: [2-3] HINT: This error does *not* mean that you have run out of disk space. It occurs either if all available shared memory IDs have been taken, in which case you need to raise the SHMMNI parameter in your kernel, or because the system's overall limit for shared memory has been reached. If you cannot increase the shared memory limit, reduce PostgreSQL's shared memory request (currently 8829517824 bytes), perhaps by reducing shared_buffers or max_connections.
    2017:11:06-10:48:25 ######-fw1 postgres[17204]: [2-4] The PostgreSQL documentation contains more information about shared memory configuration.


    In line with the HINT, I'm certainly not out of disk space:

    Filesystem Size Used Avail Use% Mounted on
    /dev/sda6 5.2G 2.7G 2.3G 54% /
    udev 34G 128K 34G 1% /dev
    tmpfs 34G 4.0K 34G 1% /dev/shm
    /dev/sda1 331M 16M 295M 5% /boot
    /dev/sda5 436G 822M 412G 1% /var/storage
    /dev/sda7 571G 129M 540G 1% /var/log
    /dev/sda8 23G 291M 21G 2% /tmp
    /dev 34G 128K 34G 1% /var/storage/chroot-clientlessvpn/dev
    tmpfs 34G 0 34G 0% /var/sec/chroot-httpd/dev/shm
    /dev 34G 128K 34G 1% /var/sec/chroot-openvpn/dev
    /dev 34G 128K 34G 1% /var/sec/chroot-ppp/dev
    /dev 34G 128K 34G 1% /var/sec/chroot-pppoe/dev
    /dev 34G 128K 34G 1% /var/sec/chroot-pptp/dev
    /dev 34G 128K 34G 1% /var/sec/chroot-pptpc/dev
    /dev 34G 128K 34G 1% /var/sec/chroot-restd/dev
    tmpfs 34G 0 34G 0% /var/storage/chroot-reverseproxy/dev/shm
    /var/storage/chroot-smtp/spool 436G 822M 412G 1% /var/sec/chroot-httpd/var/spx/spool
    /var/storage/chroot-smtp/spx 436G 822M 412G 1% /var/sec/chroot-httpd/var/spx/public/images/spx
    tmpfs 34G 4.0K 34G 1% /var/storage/chroot-smtp/tmp/ram
    tmpfs 34G 236M 34G 1% /var/storage/chroot-http/tmp
    /var/sec/chroot-afc/var/run/navl 5.2G 2.7G 2.3G 54% /var/storage/chroot-http/var/run/navl


    And my system has 64GB of RAM. I'm just completely out of my league with fixing this and if I try without guidance I will likely make things worse :) though I have no issue with using things like vi, etc. I'm a little baffled how this occurred period. The install went flawless without errors (that I saw) and was straight to 9.505. My only assumption is that this has something to do with the HP hardware and the RAID controller though this is hardware RAID, the installer had no issues seeing the HP Logical Drive and this particular system has previously run Windows and another Linux based FW for years without issue.

    Anyway, I'm sure with paid support I could get to the bottom (and maybe a fix??!?!?!?) for whatever this core of the issue is but is there something I can modify to maybe get this back working? To kind of guess, I found this page -> https://www.postgresql.org/docs/9.1/static/kernel-resources.html

    To which I found my current values are:

    ######-fw1:/proc/sys/kernel # cat shmmax
    35892152320
    ######-fw1:/proc/sys/kernel # cat shmall
    2097152

  • Hi,


    Can you check your current Postgres Status:

    https://community.sophos.com/kb/en-us/126593


    Are you running in 32 or 64 bit? 


    Cheers

    __________________________________________________________________________________________________________________

  • I definitely told it to install 64-bit...


    ######-fw1:/proc/sys/kernel # uname -m
    x86_64


    I did not attempt to run the script

    ######-fw1:/var/storage/pgsql92 # cat postgres.default
    # written by Sophos UTM Installer

    POSTGRES_ARCH="64"

Reply Children
No Data