This discussion has been locked.
You can no longer post new replies to this discussion. If you have a question you can start a new discussion

[INFO-152] Network Monitor not running - restarted

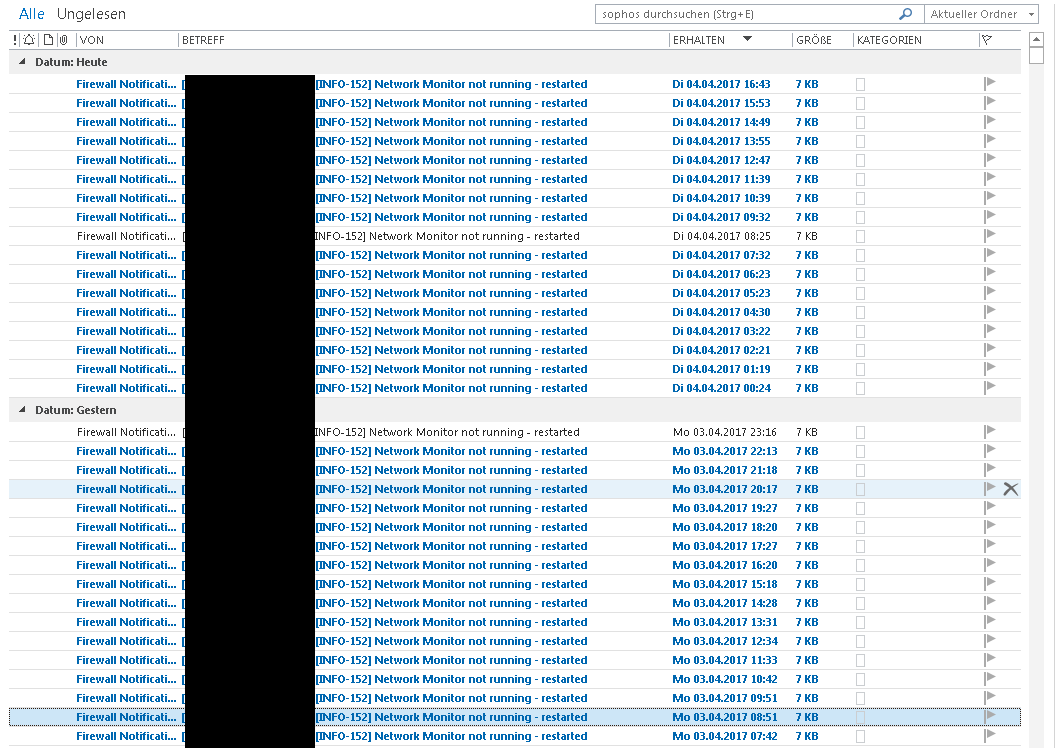
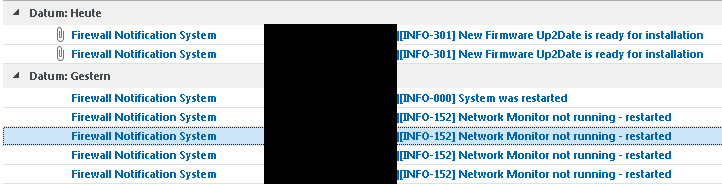
Been receiving a few webadmin info-152 e-mails from the UTM
Did a dmesg...

[1123325.232580] nwd[10968]: segfault at 2e323931 ip 000000002e323931 sp 00000000ffd900c0 error 14


Current software version...: 9.310009
Hardware type..............: Software Appliance
Installation image.........: 9.308-16.1
Installation type..........: asg
Installed pattern version..: 78536
Downloaded pattern version.: 78536
Up2Dates applied...........: 2 (see below)
                             sys-9.308-9.309-16.3.1.tgz (Mar 15 19:20)
                             sys-9.309-9.310-3.9.4.tgz (Mar 27 05:29)
Up2Dates available.........: 1
Factory resets.............: 0
Timewarps detected.........: 1

Any ideas?


This thread was automatically locked due to age.
Parents
  • 9.314 is not released yet.  Still have some other fixes to go into that one.  Give it a few weeks.  If you have a paid license, open up a support case and they MIGHT be able to apply a point patch on your system for ID34945.
    __________________
    ACE v8/SCA v9.3

    ...still have a v5 install disk in a box somewhere.

    http://xkcd.com
    http://www.tedgoff.com/mb
    http://www.projectcartoon.com/cartoon/1
  • Running on 

    9.408-4

    now.

    Still getting Mails about every hour.

    Any advice?

  • Hello,


    yes it's always the same Mail: 


    Content:

    -------------------------------------------------
    Network Monitor not running - restarted

    --

    System Uptime      : 133 days 6 hours 1 minute

    System Load        : 0.23

    System Version     : Sophos UTM 9.408-4


    Please refer to the manual for detailed instructions.

    -------------------------------------------------

    Didn't try that update now, but since we are facing this Problem since about 5 months now, I don't think the "latest" Update 
    will cause any change...


    best,

    daniel.

  • ps.: It's the sophos SG310 - if that might have any impact on the problem.

  • The first thing I would try is to restore a configuration backup made before this problem started.  If that stops the issue, then you can conclude that some process, maybe an Up2Date, damaged the configuration database.  You will need to decide if you want to modify the old configuration or restore the new one and wait for Sophos Support to fix this issue.  I don't expect that that will have been the problem though and that you'll need to follow Scott Klassen's prescription...

    If that didn't work, Sophos Support will surely ask you to re-image your SG, but you will want them to have a look at your SG first.  The following process will delete all of your logs, reporting and graphs, so be sure to get what you need before trying this:

    1. Get several recent backups off the UTM and copy the most-recent one into the root directory of a FAT32-formatted USB memory stick..
    2. Download the hardware ISO from the Sophos site and burn it to a DVD.
    3. It should take under 10 minutes to complete the following and be up-and-running again:
      • re-image the UTM from ISO (boot the UTM with a USB optical drive containing the DVD)
      • reboot the UTM with the memory stick in place to restore the backup

    Please let us know your result.

    Cheers - Bob

     
    Sophos UTM Community Moderator
    Sophos Certified Architect - UTM
    Sophos Certified Engineer - XG
    Gold Solution Partner since 2005
    MediaSoft, Inc. USA
  • Thanks for your reply. 

    Restoring "Backups" before this Problem is not an option. This would remove about 5 months of configuration done on the unit,
    while the outcome is undetermined.

    Just noted that the appliance is running since 130 days, which almost matches the date when the problems started. 
    So, I'll try a "simple" reboot, first and postback tomorrow.


  • Make a new backup before you try the restore.  After the old version gives you your answer, restore the new backup you just made.

    Trying the reboot is a great idea!

    Cheers - Bob

     
    Sophos UTM Community Moderator
    Sophos Certified Architect - UTM
    Sophos Certified Engineer - XG
    Gold Solution Partner since 2005
    MediaSoft, Inc. USA
  • Sorry, I'm not going to try the "restore". 

    My customer is NOT paying for the throwaway of about 40 hours of work that have been put into configuration overall - just to get rid of some unwanted Emails! 

    There IS a predictable reason why Emails are send by the system. (At least I hope so) - so there MUSST be a reliable way to fix the Problem without doing some childish' reset (or set-back) of the whole system!

    Remember: We are not talking about some sort of "Free-Ware" here, we are talking about an appliance worth a serious amount of bucks.

    But let's wait, what the reboot will cause. :-)

    best,

    daniel.

  • Trying the reboot was the best idea - Problem solved :P 


    So it seems that the update (which was installed) mentioned above as a fix requires a reboot.

  • Thanks for being the guinea pig in the above, Daniel.  In fact, the very same thing happened for no reason on our UTM. Beginning at 2017-04-11 04:33, the UTM began sending the notification every hour or so.  A reboot first thing this AM resolved the issue.

    Cheers - Bob

     
    Sophos UTM Community Moderator
    Sophos Certified Architect - UTM
    Sophos Certified Engineer - XG
    Gold Solution Partner since 2005
    MediaSoft, Inc. USA
  • Service Monitor not running - restarted


    I had this problem appear on version - 9.506-2 Pattern version - 135858

    It was also present on the previous version. A reboot and a disk check have failed to

    resolve the issue. The "service Monitor" service is stopping around every 30 minutes.

    The log indicates that the service stops when a reverse DNS is attempted by the system

    or a check that the target responds to an ICMP ping. The service then terminates.

    This is an exert from my "service monitor" log.

    ..............................................................................................................................

    2017:11:29-00:02:05 router service_monitor[30184]: id="4000" severity="info" sys="System" sub="loadbalancing" name="Starting real server checker with 17 threads"
    2017:11:29-00:02:05 router service_monitor[30184]: id="4002" severity="info" sys="System" sub="loadbalancing" name="Open ICMPv4 socket"
    2017:11:29-00:02:05 router service_monitor[30184]: id="4002" severity="info" sys="System" sub="loadbalancing" name="Open ICMPv6 socket"
    2017:11:29-00:02:05 router service_monitor[30184]: id="4000" severity="info" sys="System" sub="loadbalancing" name="REF_NetAvaTrsSecurTime ICMP 46.101.55.10 changed state to ONLINE"
    2017:11:29-00:02:05 router service_monitor[30184]: id="4000" severity="info" sys="System" sub="loadbalancing" name="Set Availability Group REF_NetAvaTrsSecurTime to 46.101.55.10"
    2017:11:29-00:02:05 router service_monitor[30184]: id="4000" severity="info" sys="System" sub="loadbalancing" name="REF_NetAvaSecurDnsResol ICMP 90.207.238.97 changed state to ONLINE"
    2017:11:29-00:02:05 router service_monitor[30184]: id="4000" severity="info" sys="System" sub="loadbalancing" name="Set Availability Group REF_NetAvaSecurDnsResol to 90.207.238.97"
    2017:11:29-00:02:05 router service_monitor[30184]: id="4000" severity="info" sys="System" sub="loadbalancing" name="REF_NetAvaSecurDnsResol ICMP 8.8.8.8 changed state to ONLINE"
    2017:11:29-00:02:05 router service_monitor[30184]: id="4000" severity="info" sys="System" sub="loadbalancing" name="REF_NetAvaSecurDnsResol ICMP 208.67.222.222 changed state to ONLINE"
    2017:11:29-00:02:05 router service_monitor[30184]: id="4000" severity="info" sys="System" sub="loadbalancing" name="REF_NetAvaSecurDnsResol ICMP 208.67.222.123 changed state to ONLINE"
    2017:11:29-00:02:05 router service_monitor[30184]: id="4000" severity="info" sys="System" sub="loadbalancing" name="REF_NetAvaMultiDnsResol ICMP 8.8.8.8 changed state to ONLINE"
    2017:11:29-00:02:05 router service_monitor[30184]: id="4000" severity="info" sys="System" sub="loadbalancing" name="Set Availability Group REF_NetAvaMultiDnsResol to 8.8.8.8"
    2017:11:29-00:02:05 router service_monitor[30184]: id="4000" severity="info" sys="System" sub="loadbalancing" name="REF_NetAvaMultiDnsResol ICMP 90.207.238.97 changed state to ONLINE"
    2017:11:29-00:02:05 router service_monitor[30184]: id="4000" severity="info" sys="System" sub="loadbalancing" name="REF_NetAvaSecurDnsResol ICMP 90.207.238.99 changed state to ONLINE"
    2017:11:29-00:02:05 router service_monitor[30184]: id="4000" severity="info" sys="System" sub="loadbalancing" name="REF_NetAvaTrsSecurTime ICMP 192.146.137.13 changed state to ONLINE"
    2017:11:29-00:02:05 router service_monitor[30184]: id="4000" severity="info" sys="System" sub="loadbalancing" name="REF_NetAvaSecurDnsResol ICMP 8.8.4.4 changed state to ONLINE"
    2017:11:29-00:02:05 router service_monitor[30184]: id="4000" severity="info" sys="System" sub="loadbalancing" name="REF_NetAvaSecurDnsResol ICMP 208.67.220.220 changed state to ONLINE"
    2017:11:29-00:02:05 router service_monitor[30184]: id="4000" severity="info" sys="System" sub="loadbalancing" name="REF_NetAvaSecurDnsResol ICMP 208.67.220.123 changed state to ONLINE"
    2017:11:29-00:02:05 router service_monitor[30184]: id="4000" severity="info" sys="System" sub="loadbalancing" name="REF_NetAvaMultiDnsResol ICMP 8.8.4.4 changed state to ONLINE"
    2017:11:29-00:02:05 router service_monitor[30184]: id="4000" severity="info" sys="System" sub="loadbalancing" name="REF_NetAvaMultiDnsResol ICMP 90.207.238.99 changed state to ONLINE"
    2017:11:29-00:02:05 router service_monitor[30184]: id="4000" severity="info" sys="System" sub="loadbalancing" name="Set Availability Group REF_NetAvaTrsSecurTime to 192.146.137.13"
    2017:11:29-00:02:05 router service_monitor[30184]: id="4000" severity="info" sys="System" sub="loadbalancing" name="Set Availability Group REF_NetAvaSecurDnsResol to 8.8.8.8"
    2017:11:29-00:02:05 router service_monitor[30184]: id="4000" severity="info" sys="System" sub="loadbalancing" name="Set Availability Group REF_NetAvaMultiDnsResol to 90.207.238.97"
    2017:11:29-00:02:06 router service_monitor[30184]: id="4000" severity="info" sys="System" sub="loadbalancing" name="Set Availability Group REF_NetAvaSecurDnsResol to 208.67.222.222"
    2017:11:29-00:02:06 router service_monitor[30184]: id="4000" severity="info" sys="System" sub="loadbalancing" name="Set Availability Group REF_NetAvaMultiDnsResol to 90.207.238.97"
    2017:11:29-00:02:06 router service_monitor[30184]: id="4000" severity="info" sys="System" sub="loadbalancing" name="Set Availability Group REF_NetAvaSecurDnsResol to 208.67.222.123"
    2017:11:29-00:02:07 router service_monitor[30184]: id="4000" severity="info" sys="System" sub="loadbalancing" name="Set Availability Group REF_NetAvaSecurDnsResol to 208.67.222.123"
    2017:11:29-00:02:07 router service_monitor[30184]: id="4000" severity="info" sys="System" sub="loadbalancing" name="Set Availability Group REF_NetAvaSecurDnsResol to 208.67.222.123"
    2017:11:29-00:02:08 router service_monitor[30184]: id="4000" severity="info" sys="System" sub="loadbalancing" name="Set Availability Group REF_NetAvaSecurDnsResol to 208.67.222.123"
    2017:11:29-00:02:10 router service_monitor[30184]: id="4000" severity="info" sys="System" sub="loadbalancing" name="REF_NetAvaTrsSecurTime ICMP 95.215.175.2 changed state to OFFLINE"
    2017:11:29-00:02:10 router service_monitor[30184]: id="4000" severity="info" sys="System" sub="loadbalancing" name="Set Availability Group REF_NetAvaTrsSecurTime to 192.146.137.13"
    2017:11:29-00:02:10 router service_monitor[30184]: id="4000" severity="info" sys="System" sub="loadbalancing" name="REF_NetAvaTrsSecurTime ICMP 139.143.5.31 changed state to OFFLINE"
    2017:11:29-00:02:10 router service_monitor[30184]: id="4000" severity="info" sys="System" sub="loadbalancing" name="REF_NetAvaTrsSecurTime ICMP 139.143.5.30 changed state to OFFLINE"
    2017:11:29-00:02:10 router service_monitor[30184]: id="4000" severity="info" sys="System" sub="loadbalancing" name="Set Availability Group REF_NetAvaTrsSecurTime to 192.146.137.13"
    2017:11:29-00:02:11 router service_monitor[30184]: id="4000" severity="info" sys="System" sub="loadbalancing" name="Set Availability Group REF_NetAvaTrsSecurTime to 192.146.137.13"
    2017:11:29-00:07:05 router service_monitor[30184]: id="4000" severity="info" sys="System" sub="loadbalancing" name="Exiting..."
    2017:11:29-00:07:05 router service_monitor[30184]: id="4002" severity="info" sys="System" sub="loadbalancing" name="Waiting for thread 3599"
    2017:11:29-00:07:06 router service_monitor[30184]: id="4002" severity="info" sys="System" sub="loadbalancing" name="Waiting for thread 3587"
    2017:11:29-00:07:07 router service_monitor[30184]: id="4002" severity="info" sys="System" sub="loadbalancing" name="Waiting for thread 3587"
    2017:11:29-00:07:07 router service_monitor[30184]: id="4002" severity="info" sys="System" sub="loadbalancing" name="Waiting for thread 3587"
    2017:11:29-00:07:08 router service_monitor[30184]: id="4002" severity="info" sys="System" sub="loadbalancing" name="Waiting for thread 3587"
    2017:11:29-00:07:09 router service_monitor[30184]: id="4002" severity="info" sys="System" sub="loadbalancing" name="Waiting for thread 3587"

    The next entry is the service restarting...

    2017:11:29-00:07:10 router service_monitor[30526]: id="4000" severity="info" sys="System" sub="loadbalancing" name="Starting real server checker with 17 threads"


    I am going to try changing the NTP and DNS clients but I doubt that will make any difference.

    A rather irritating problem and it appears I am not alone in having this issue. Has anyone found a solution to this problem?

    Stuart.


  • Update.....

    I changed the hdd in the system and reloaded from the latest image. System status is...

    Firmware version:9.506-2

    Pattern version:136417

    Configured with one lan interface and one wan interface.

    Standard NAT configured and firewall rule of   Any ----> Any ----> Any

    No other services active not even DHCP.


    That and I only just realised I posted the wrong log file entries. Oops [:$]

    This is the correct log AFAIK....

    2017:12:11-08:34:35 router selfmonng[3935]: I check Failed increment service_monitor_running counter 1 - 3
    2017:12:11-08:34:40 router selfmonng[3935]: I check Failed increment service_monitor_running counter 2 - 3
    2017:12:11-08:34:45 router selfmonng[3935]: W check Failed increment service_monitor_running counter 3 - 3
    2017:12:11-08:34:45 router selfmonng[3935]: [INFO-181] Service Monitor not running - restarted
    2017:12:11-08:34:45 router selfmonng[3935]: W NOTIFYEVENT Name=service_monitor_running Level=INFO Id=181 sent
    2017:12:11-08:34:45 router selfmonng[3935]: W triggerAction: 'cmd'
    2017:12:11-08:34:45 router selfmonng[3935]: W actionCmd(+):  '/var/mdw/scripts/service_monitor restart'
    2017:12:11-08:34:45 router selfmonng[3935]: W child returned status: exit='0' signal='0'

    I noticed this on the " Up to Date Log " .....

    2017:12:11-08:28:11 router audld[2722]: Could not connect to Authentication Server 79.125.21.244 (code=500 500 Internal Server Error). 2017:12:11-08:28:20 router audld[2722]: id="3701" severity="info" sys="system" sub="up2date" name="Authentication successful" 2017:12:11-08:43:01 router audld[4029]: no HA system or cluster node 2017:12:11-08:43:01 router audld[4029]: Starting Up2Date Package Downloader 2017:12:11-08:43:02 router audld[4029]: patch up2date possible 2017:12:11-08:43:18 router audld[4029]: id="3701" severity="info" sys="system" sub="up2date" name="Authentication successful"

    I dont know if its related but this coincides with a NTP update ????

    These emails are still coming in every 30 minutes to an hour and are starting to bear a close relationship with the mother in-law.

    Any idea's anyone ?

    !! I used to think I was indecisive but now I am not so sure !!

Reply
  • Update.....

    I changed the hdd in the system and reloaded from the latest image. System status is...

    Firmware version:9.506-2

    Pattern version:136417

    Configured with one lan interface and one wan interface.

    Standard NAT configured and firewall rule of   Any ----> Any ----> Any

    No other services active not even DHCP.


    That and I only just realised I posted the wrong log file entries. Oops [:$]

    This is the correct log AFAIK....

    2017:12:11-08:34:35 router selfmonng[3935]: I check Failed increment service_monitor_running counter 1 - 3
    2017:12:11-08:34:40 router selfmonng[3935]: I check Failed increment service_monitor_running counter 2 - 3
    2017:12:11-08:34:45 router selfmonng[3935]: W check Failed increment service_monitor_running counter 3 - 3
    2017:12:11-08:34:45 router selfmonng[3935]: [INFO-181] Service Monitor not running - restarted
    2017:12:11-08:34:45 router selfmonng[3935]: W NOTIFYEVENT Name=service_monitor_running Level=INFO Id=181 sent
    2017:12:11-08:34:45 router selfmonng[3935]: W triggerAction: 'cmd'
    2017:12:11-08:34:45 router selfmonng[3935]: W actionCmd(+):  '/var/mdw/scripts/service_monitor restart'
    2017:12:11-08:34:45 router selfmonng[3935]: W child returned status: exit='0' signal='0'

    I noticed this on the " Up to Date Log " .....

    2017:12:11-08:28:11 router audld[2722]: Could not connect to Authentication Server 79.125.21.244 (code=500 500 Internal Server Error). 2017:12:11-08:28:20 router audld[2722]: id="3701" severity="info" sys="system" sub="up2date" name="Authentication successful" 2017:12:11-08:43:01 router audld[4029]: no HA system or cluster node 2017:12:11-08:43:01 router audld[4029]: Starting Up2Date Package Downloader 2017:12:11-08:43:02 router audld[4029]: patch up2date possible 2017:12:11-08:43:18 router audld[4029]: id="3701" severity="info" sys="system" sub="up2date" name="Authentication successful"

    I dont know if its related but this coincides with a NTP update ????

    These emails are still coming in every 30 minutes to an hour and are starting to bear a close relationship with the mother in-law.

    Any idea's anyone ?

    !! I used to think I was indecisive but now I am not so sure !!

Children
  • After the latest update it stopped until... I updated a week later the second machine (HA).
    Now it's all the same, and I'm getting 5-6 "Network Monitor not running – restarted" every day.

    I have to say that Sophos team are not much of a help here.

    I'm having this bug for nearly a year now.
    For my opinion, it's unacceptable that a big name like Sophos, during all those months, couldn't find and fix this issue, or at least send me an RPM for resolving this issue.
    That is rally annoying, and all I get from Sophos is that they thanks me for my patient.
    Come on guys, i'm sure yo could do better?

  • Goldy, out of the dozens of UTMs I've worked on and from which I still receive notifications, I'm not seeing this from any of them.  I checked the logs since 1/1/2018.

    Cheers - Bob

     
    Sophos UTM Community Moderator
    Sophos Certified Architect - UTM
    Sophos Certified Engineer - XG
    Gold Solution Partner since 2005
    MediaSoft, Inc. USA
  • Hi Bob.

    Are they having HA?

    Thank.

  • At least 4 are in HA with SG appliances.

    Cheers - Bob

     
    Sophos UTM Community Moderator
    Sophos Certified Architect - UTM
    Sophos Certified Engineer - XG
    Gold Solution Partner since 2005
    MediaSoft, Inc. USA