This discussion has been locked.
You can no longer post new replies to this discussion. If you have a question you can start a new discussion

High CPU load after update to UTM 9.700-5

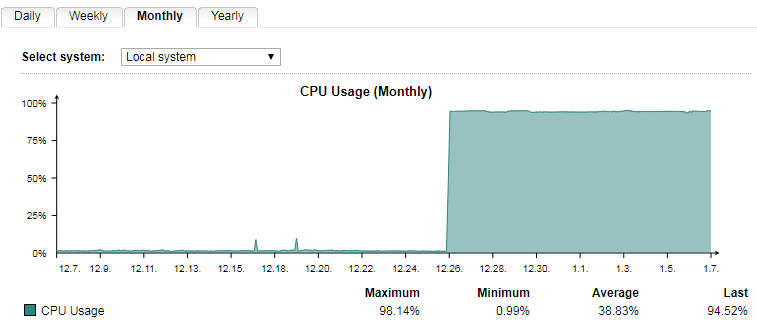
Since the up2date 9.700-5 update, CPU on our master SG210 is running >94%.

Top is showing this: 

Cpu(s): 41.7%us, 47.9%sy,  0.0%ni,  5.0%id,  0.0%wa,  0.0%hi,  5.3%si,  0.0%st

HA lgo says:

2020:01:07-16:57:51 repctl[10837]: [c] standby_clone(936): 'module' => 'postgres-default'
2020:01:07-16:57:51 repctl[10837]: [c] standby_clone(936): };
2020:01:07-16:57:51 repctl[10837]: [c] standby_clone(936): (Attempt #:10)
2020:01:07-16:58:01 repctl[10837]: [w] master_connection(2015): check_dbh: -1
2020:01:07-16:58:03 repctl[10837]: [i] stop_backup_mode(765): stopped backup mode at 00000001000010B0000000DD
2020:01:07-16:58:03 repctl[10837]: [c] standby_clone(950): standby_clone failed: sync aborted (never executed successfully)
2020:01:07-16:58:03 repctl[10837]: [e] prepare_secondary(346): prepare_secondary: clone failed
2020:01:07-16:58:03 repctl[10837]: [c] prepare_secondary(360): failed to get database up, waiting for retry
2020:01:07-16:58:03 repctl[10837]: [c] setup_replication(274): setup_replication was not properly executed
2020:01:07-16:58:03 repctl[10837]: [i] setup_replication(278): checkinterval 300

Any remediation suggestions?

Regards,

Koen


This thread was automatically locked due to age.
Parents
  • FormerMember
    0 FormerMember

    Hi KoenDooms,

    I would suggest you to provide output of top command, it will help us identify which process it taking high CPU. Check if there is one specific process shows up taking high CPU. 

    Thanks,

  • I rebooted master that had high CPU load, but slave that is now running as master has same high CPU load.

    This is the top output:

    top - 13:27:11 up 20:23, 1 user, load average: 2.84, 2.73, 2.65
    Tasks: 146 total, 4 running, 140 sleeping, 0 stopped, 2 zombie
    Cpu(s): 48.7%us, 43.1%sy, 0.0%ni, 4.2%id, 0.0%wa, 0.0%hi, 4.0%si, 0.0%st
    Mem: 8101360k total, 2444980k used, 5656380k free, 282860k buffers
    Swap: 4194296k total, 0k used, 4194296k free, 790612k cached

    PID USER PR NI VIRT RES SHR S %CPU %MEM TIME+ COMMAND
    6259 snort 15 -5 382m 368m 4052 S 21 4.7 122:02.62 snort
    24435 root 20 0 0 0 0 Z 11 0.0 0:00.34 confd.plx <defunct>
    24316 root 20 0 18676 12m 2952 S 7 0.2 0:00.21 pfilter-reporte
    6349 root 20 0 14888 9536 2844 S 6 0.1 66:19.79 syslog-ng
    4668 root 15 -5 24400 20m 596 R 2 0.3 7:07.02 conntrackd
    13097 afcd 19 -1 102m 79m 8004 S 2 1.0 12:13.65 afcd
    3666 root 20 0 8316 4436 196 R 1 0.1 12:55.38 haveged
    3 root 20 0 0 0 0 S 0 0.0 3:18.99 ksoftirqd/0
    4446 root 20 0 13776 9924 2528 S 0 0.1 2:31.54 selfmonng.plx
    12236 root 20 0 4548 1044 872 S 0 0.0 0:01.02 waf-reporter
    24016 root 20 0 0 0 0 S 0 0.0 0:00.93 kworker/0:0
    1 root 20 0 3976 580 508 S 0 0.0 0:01.24 init
    2 root 20 0 0 0 0 S 0 0.0 0:00.00 kthreadd
    5 root 0 -20 0 0 0 S 0 0.0 0:00.00 kworker/0:0H
    7 root RT 0 0 0 0 S 0 0.0 0:21.47 migration/0
    8 root 20 0 0 0 0 S 0 0.0 0:00.00 rcu_bh
    9 root 20 0 0 0 0 S 0 0.0 2:35.41 rcu_sched
    10 root RT 0 0 0 0 S 0 0.0 0:15.80 migration/1
    11 root 20 0 0 0 0 S 0 0.0 2:15.76 ksoftirqd/1
    12 root 20 0 0 0 0 S 0 0.0 0:00.00 kworker/1:0
    13 root 0 -20 0 0 0 S 0 0.0 0:00.00 kworker/1:0H
    14 root 0 -20 0 0 0 S 0 0.0 0:00.00 khelper
    15 root 20 0 0 0 0 S 0 0.0 0:01.34 kworker/u4:1
    123 root 0 -20 0 0 0 S 0 0.0 0:00.00 writeback
    126 root 0 -20 0 0 0 S 0 0.0 0:00.00 bioset
    127 root 0 -20 0 0 0 S 0 0.0 0:00.00 crypto
    129 root 0 -20 0 0 0 S 0 0.0 0:00.00 kblockd
    319 root 20 0 0 0 0 S 0 0.0 0:00.07 khubd
    327 root 0 -20 0 0 0 S 0 0.0 0:00.00 edac-poller
    446 root 20 0 0 0 0 S 0 0.0 0:00.00 kswapd0
    511 root 39 19 0 0 0 S 0 0.0 0:00.32 khugepaged
    512 root 20 0 0 0 0 S 0 0.0 0:00.00 fsnotify_mark
    1142 root 0 -20 0 0 0 S 0 0.0 0:00.00 deferwq
    1158 root 20 0 27936 21m 2972 S 0 0.3 0:00.43 admin-reporter.
    1226 root 0 -20 0 0 0 S 0 0.0 0:00.00 ata_sff
    1244 root 20 0 0 0 0 S 0 0.0 0:00.04 scsi_eh_0
    1247 root 20 0 0 0 0 S 0 0.0 0:00.00 scsi_eh_1
    1250 root 20 0 0 0 0 S 0 0.0 0:00.00 scsi_eh_2
    1253 root 20 0 0 0 0 S 0 0.0 0:00.00 scsi_eh_3
    1257 root 20 0 0 0 0 S 0 0.0 0:00.04 kworker/u4:3
    1501 root 20 0 8108 3204 2544 S 0 0.0 0:00.12 sshd
    2519 root 0 -20 0 0 0 S 0 0.0 0:02.18 kworker/0:1H
    2520 root 0 -20 0 0 0 S 0 0.0 0:00.06 kworker/1:1H
    2582 root 20 0 0 0 0 S 0 0.0 0:01.10 jbd2/sda6-8
    2583 root 0 -20 0 0 0 S 0 0.0 0:00.00 ext4-rsv-conver

  • FormerMember
    0 FormerMember in reply to KoenDooms

    Hi KoenDooms,

    Thank you for providing the output of top command. In your case service "Snort" is the one taking high CPU. Can you please confirm is you have any recent event of Pattern update not being updated in up2date.log? If you do not see any log entry with Pattern update failing to install, please check your IPS configuration and verify the Pattern rule age? 

    Thanks,

  • Hi KoenDooms,

    try to disable IPS for one minute and check if CPU goes down ... i think not.


    Dirk

    Systema Gesellschaft für angewandte Datentechnik mbH  // Sophos Platinum Partner
    Sophos Solution Partner since 2003
    If a post solves your question, click the 'Verify Answer' link at this post.

Reply
  • Hi KoenDooms,

    try to disable IPS for one minute and check if CPU goes down ... i think not.


    Dirk

    Systema Gesellschaft für angewandte Datentechnik mbH  // Sophos Platinum Partner
    Sophos Solution Partner since 2003
    If a post solves your question, click the 'Verify Answer' link at this post.

Children