This discussion has been locked.
You can no longer post new replies to this discussion. If you have a question you can start a new discussion

Memory Usage: what do you think?

Dear all

A warning message regarding memory usage draw my attention, found in Up2Date -> Overview. Sophos UTM 9.506-2.

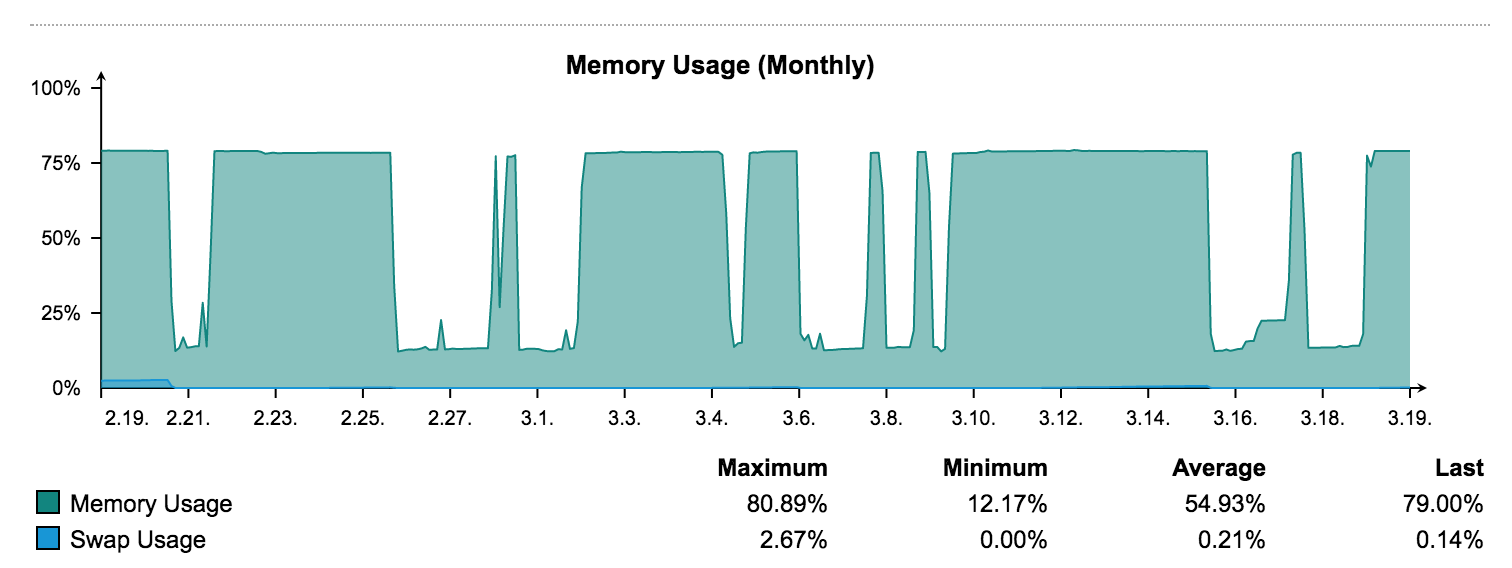
Not finding anything particular I rebooted UTM which freed up memory significant. From 75% to around 10%.
See below graphic from the (RAM) memory usage report.

It didn't bother me much as SWAP isn't used at all. Further, it obviously stops consumption on 75%.
However the system throws a warning... and well, I just like warning-free systems ;-) 

What do you think? Is there a way to have it freeing up memory on its own? What are the factors?

Kind regards

n3


Graph of Memory Usage before and after reboot


This thread was automatically locked due to age.
Parents
  • Hi noviceiii,

    how much RAM do you have in the UTM?

    XG & UTM Architect (Systems: XG v18 & UTM 9.7 - Virtual, HW & SW)
    Curious enough to take it apart, skilled enough to put it back together, Clever enough to hide the extra parts when I'm Done!

  • Hi Jason

    Thanks for asking.
    There is currently 16 GB assigned (it is running on an ESXi).
    This is plenty, isn't it (for home use)?

    ... maybe I'll assign 32 GB since there ist plenty in the ESXi too..

    Greetings
    n3

  • I have 8Gb on My unit at home, but this is not on a hyper-visor.

    it also depends on the following;

    1. How many rules.

    2. Country blocking enabled.

    3. web-filter policies.

    4. IPS configuration (having all of them enabled can consume a lot of memory).

    maybe reduce the attack patterns down to what you actually have.

    5. How many modules you have running (and are using).

    XG & UTM Architect (Systems: XG v18 & UTM 9.7 - Virtual, HW & SW)
    Curious enough to take it apart, skilled enough to put it back together, Clever enough to hide the extra parts when I'm Done!

  • noviceiii, 16GB should be more than enough.  The next time you see this, run top to see what's eating your RAM and come back and tell us.

    Cheers - Bob

     
    Sophos UTM Community Moderator
    Sophos Certified Architect - UTM
    Sophos Certified Engineer - XG
    Gold Solution Partner since 2005
    MediaSoft, Inc. USA
  • Dear all

    I wasn't able to reproduce the case since it raised my attention.
    After a reboot, memory was always freed up from time to time. I still see days with memory high (and low network load) but as long as it decreases again (see below graph)... well

    Meanwhile, I have changed several things

    • upgraded to 9.508-10
    • Introduced a IoT network where all the phone home devices are located (and previously often ran into IPS/FW)
    • corrected my wrong understanding (and therefore all related settings) of External (Network) vs. Internet IP4

    However, I'll keep an eye on it once in a while and when catching it on high memory, verify the task with Shell -> TOP. And sure, would report back findings.

    Greetings

    N3


  • Dear all

    I kept monitoring the issue. I currently have constantly 75% again for about 3 weeks.
    The shell didn't show anything unusual (at least for me ;-) ).

    I am not much bothered since the UTM runs smoothly.

    However, just curious why it holds that 75% line constantly after maybe two weeks of uptime.
    Maybe we can't see the reduction to a lower value because the graph resolution is to rough?

    Regards,
    n3


    MEM (16055 MB Total, 15789 MB Used). So far in line with the report.

    total used free shared buffers cached
    Mem: 16055 15789 266 262 245 2847
    Low: 16055 15789 266
    High: 0 0 0
    -/+ buffers/cache: 12696 3359
    Swap: 5119 141 4978


    TOP

    PID USER PR NI VIRT RES SHR S %CPU %MEM TIME+ COMMAND
    23638 httpprox 20 0 951m 600m 10m S 1 3.7 65:27.78 httpproxy
    6011 root 20 0 585m 529m 5360 S 0 3.3 22:21.12 cssd
    4779 postgres 20 0 1604m 203m 203m S 0 1.3 4:45.24 postgres
    5556 root 20 0 193m 161m 2216 S 0 1.0 14:55.94 named
    4840 root 20 0 151m 125m 3652 S 0 0.8 14:21.46 mdw.plx
    23610 httpprox 20 0 133m 104m 45m S 0 0.7 13:27.92 urid
    8098 wwwrun 20 0 95672 89m 10m S 0 0.6 0:02.10 webadmin.plx
    30707 snort 15 -5 102m 85m 1084 S 0 0.5 11:27.66 snort
    30711 snort 15 -5 106m 81m 1144 S 0 0.5 21:45.88 snort
    30702 snort 15 -5 104m 80m 1168 S 0 0.5 9:39.76 snort
    31352 afcd 19 -1 101m 52m 6992 S 0 0.3 0:25.77 afcd
    4777 postgres 20 0 1603m 47m 47m S 0 0.3 0:38.31 postgres
    9748 root 20 0 77068 40m 3592 S 0 0.3 0:01.14 confd.plx
    31249 postgres 20 0 1608m 35m 33m S 0 0.2 0:22.41 postgres
    28217 wwwrun 20 0 55016 31m 0 S 0 0.2 0:00.47 index.plx
    5954 root 20 0 71236 31m 8428 S 0 0.2 4:00.72 ctasd.bin
    4337 root 20 0 57772 25m 3712 S 0 0.2 6:45.31 confd.plx 


    PS

    ps -eo pmem,pcpu,vsize,pid,cmd | sort -k 1 -nr | head -5
    3.7 0.2 973992 23638 /var/chroot-http/usr/bin/httpproxy -f -c /var/chroot-http -u httpproxy
    3.2 0.0 599476 6011 /usr/bin/cssd -d
    1.2 0.0 1643096 4779 postgres: checkpointer process
    1.0 0.0 198420 5556 /usr/sbin/named -4
    0.7 0.0 155000 4840 /var/mdw/mdw.plx


    ... how to paste code in here properly?


Reply
  • Dear all

    I kept monitoring the issue. I currently have constantly 75% again for about 3 weeks.
    The shell didn't show anything unusual (at least for me ;-) ).

    I am not much bothered since the UTM runs smoothly.

    However, just curious why it holds that 75% line constantly after maybe two weeks of uptime.
    Maybe we can't see the reduction to a lower value because the graph resolution is to rough?

    Regards,
    n3


    MEM (16055 MB Total, 15789 MB Used). So far in line with the report.

    total used free shared buffers cached
    Mem: 16055 15789 266 262 245 2847
    Low: 16055 15789 266
    High: 0 0 0
    -/+ buffers/cache: 12696 3359
    Swap: 5119 141 4978


    TOP

    PID USER PR NI VIRT RES SHR S %CPU %MEM TIME+ COMMAND
    23638 httpprox 20 0 951m 600m 10m S 1 3.7 65:27.78 httpproxy
    6011 root 20 0 585m 529m 5360 S 0 3.3 22:21.12 cssd
    4779 postgres 20 0 1604m 203m 203m S 0 1.3 4:45.24 postgres
    5556 root 20 0 193m 161m 2216 S 0 1.0 14:55.94 named
    4840 root 20 0 151m 125m 3652 S 0 0.8 14:21.46 mdw.plx
    23610 httpprox 20 0 133m 104m 45m S 0 0.7 13:27.92 urid
    8098 wwwrun 20 0 95672 89m 10m S 0 0.6 0:02.10 webadmin.plx
    30707 snort 15 -5 102m 85m 1084 S 0 0.5 11:27.66 snort
    30711 snort 15 -5 106m 81m 1144 S 0 0.5 21:45.88 snort
    30702 snort 15 -5 104m 80m 1168 S 0 0.5 9:39.76 snort
    31352 afcd 19 -1 101m 52m 6992 S 0 0.3 0:25.77 afcd
    4777 postgres 20 0 1603m 47m 47m S 0 0.3 0:38.31 postgres
    9748 root 20 0 77068 40m 3592 S 0 0.3 0:01.14 confd.plx
    31249 postgres 20 0 1608m 35m 33m S 0 0.2 0:22.41 postgres
    28217 wwwrun 20 0 55016 31m 0 S 0 0.2 0:00.47 index.plx
    5954 root 20 0 71236 31m 8428 S 0 0.2 4:00.72 ctasd.bin
    4337 root 20 0 57772 25m 3712 S 0 0.2 6:45.31 confd.plx 


    PS

    ps -eo pmem,pcpu,vsize,pid,cmd | sort -k 1 -nr | head -5
    3.7 0.2 973992 23638 /var/chroot-http/usr/bin/httpproxy -f -c /var/chroot-http -u httpproxy
    3.2 0.0 599476 6011 /usr/bin/cssd -d
    1.2 0.0 1643096 4779 postgres: checkpointer process
    1.0 0.0 198420 5556 /usr/sbin/named -4
    0.7 0.0 155000 4840 /var/mdw/mdw.plx


    ... how to paste code in here properly?


Children
No Data