This discussion has been locked.
You can no longer post new replies to this discussion. If you have a question you can start a new discussion

How to get traffic usage reports with accurate figures?

Does the UTM ignore certain traffic types in its reports by default?

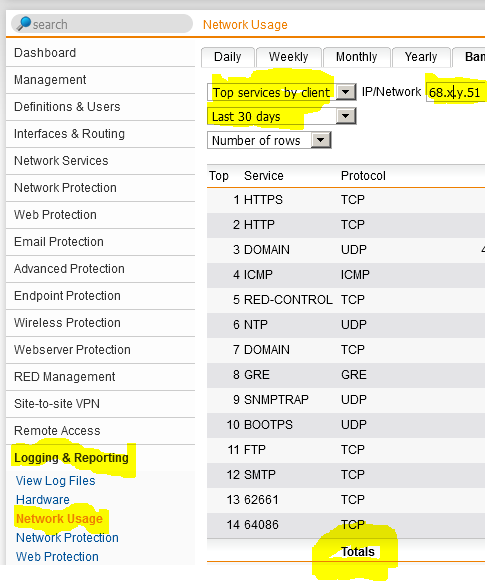
When I look, for example, at my daily report, it says my PC is the 2nd top client with 105GB and the top client is the external WAN address with 109GB.

However, the top application is Backblaze with 203GB.  How can I upload 203GB if my PC is only 105GB?

Am I reading it incorrectly?  is Backblaze being counted twice in the report; once for the internal interface (from my PC) and once for the external interface (to the internet)?


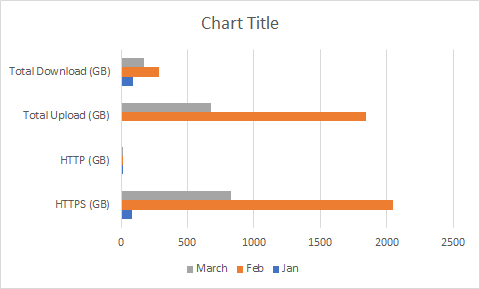
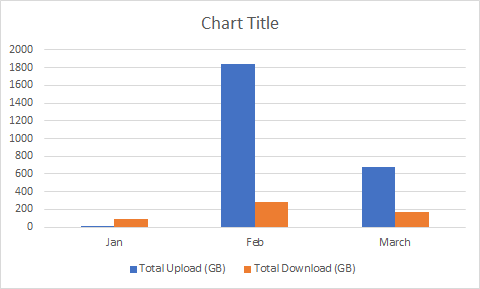
Ideally, what I want to know is:  how much upload and download do I have on the external interface - this will allow me to figure out the Internet plan I need.

It would be 'cool' to know how much traffic is bounced around internally too, but not really needed.


This thread was automatically locked due to age.
  • Hi  

    Please go through this UTM 9 help link: https://utm.trysophos.com/help/en_US/Content/master/logging_reporting/Network_Usage-Bandwidth_Usage.htm It should help you clearly understand how reporting works in UTM 9.

    Regards

    Jaydeep

  • Hi Dave,

    Just look at the total in/outbound traffic on the IPs of each WAN interface.  It sounds like you're trying something trickier, but it's not necessary.

    Just do the following for both client & server and look at the Totals at the bottom.

    Cheers - Bob

     
    Sophos UTM Community Moderator
    Sophos Certified Architect - UTM
    Sophos Certified Engineer - XG
    Gold Solution Partner since 2005
    MediaSoft, Inc. USA
  • Sorry it's taken a while, I was distracted elsewhere.

    Ok, that report seems to be be what I wanted, it even breaks it into months which is nice.  

    Other than copy/paste in excel, is there a way to expose the numbers each month for, say, a year?

  • There is an export CSV button in this overview but I'm not sure if that is what you are looking for...


    Managing several Sophos firewalls both at work and at some home locations, dedicated to continuously improve IT-security and feeling well helping others with their IT-security challenges.

  • Thanks.  

    Yes I saw that, but it exports the current view.  So I would export January, then February, then March etc.  And then copy and paste the results into another sheet (with some manipulation required) to end up with Jan, Feb, March figures in different rows so graphs can be drawn up showing how the monthly usage changes

    Like this;


    or simply this;


    If I have to copy figures manually, that's fine.  I'm a bit surprised though, considering this is an Enterprise tool (even though I'm using the free version for home) and capacity planning is a key concept for business.