This discussion has been locked.
You can no longer post new replies to this discussion. If you have a question you can start a new discussion

Possible Memory Problem after Windows 10 1903 Update


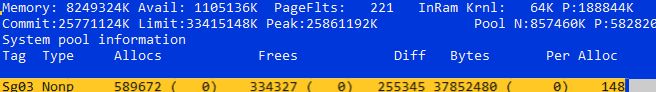
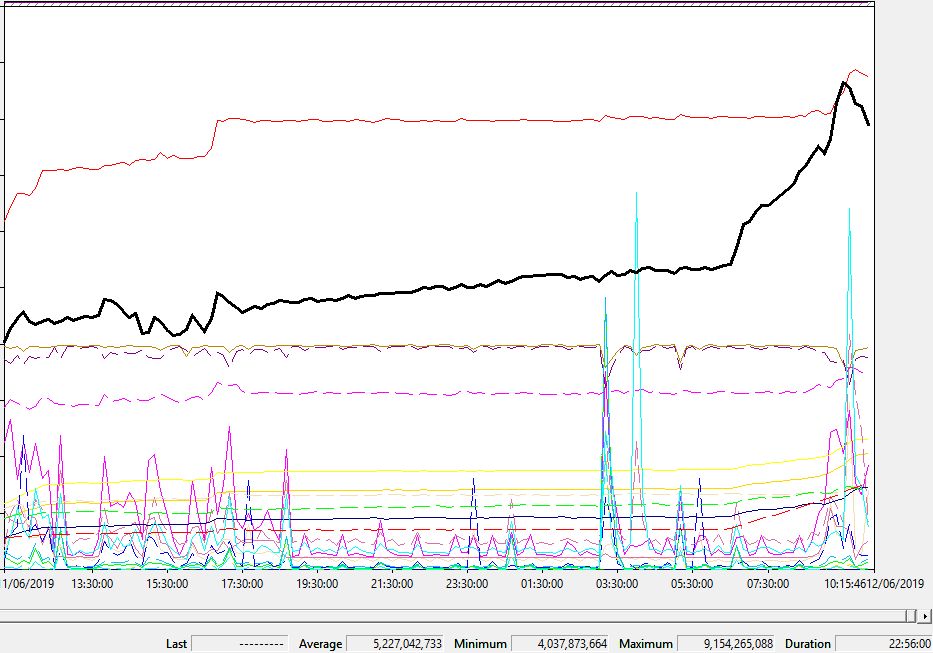
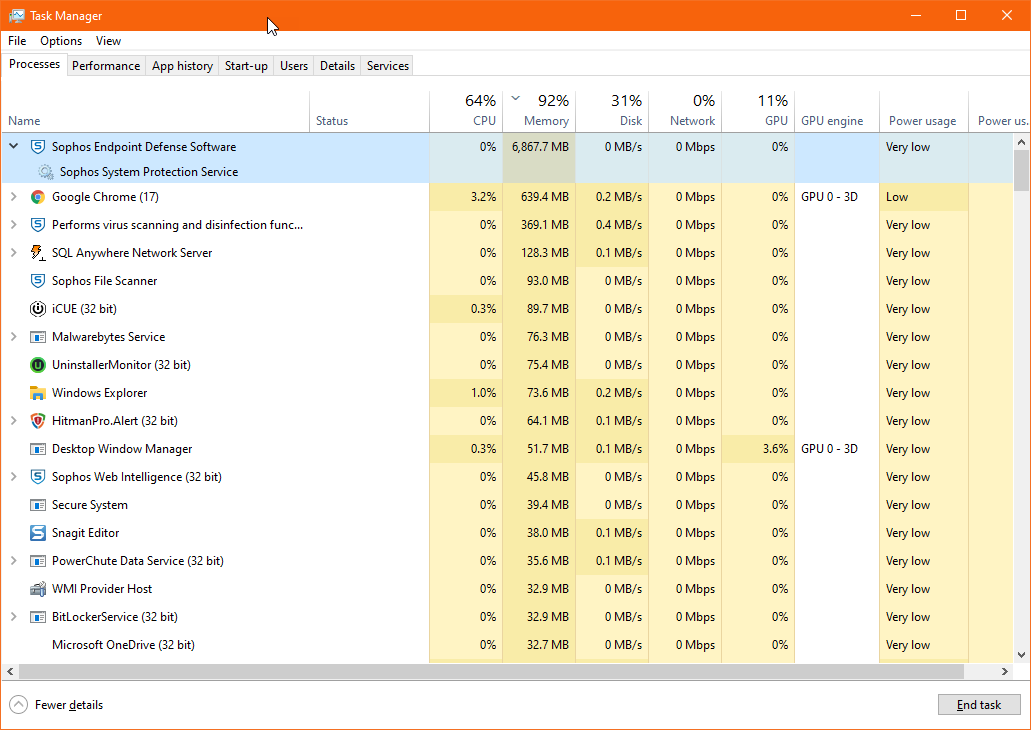
Currently have Sophos Central with Sophos Endpoint running on several machines here, i was the first to update to the latest Windows 10 1903 Update and noticed after the machine sitting idle for a while that the above service is consuming a lot of RAM.


Any solutions to this?


This thread was automatically locked due to age.
  • Hi Everyone,

    We're deeply apologetic for the inconvenience caused. I wanted to share with you that Development is actively working to determine the root-cause of the said issue. As soon as there's a Knowledgebase article published [if and when] it will be shared with the Community. 

    We encourage the few affected customers to raise a Support Ticket with us wherein we'll be happy to bring in logging which may help us during the ongoing investigation.

    Thank you,

    Vikas

  • Disabling tamper protection does not resolve the problem.

    EDR is not enabled.

    I'd need to know more about the consequences of preventing the Sophos ED driver from loading before doing that but if it prevents SSPService from starting it will definitely resolve the problem!


  • I'm having the exact same issue, 2 mornings in a row I have had to reboot.  I discovered Sophos Endpoint Protection using 22 GB of my 32 GB this morning.  I'm running Windows 10 Pro 1903.  I have submitted a ticket with Sophos and sent them the SDU Logs.

  • Useful to know, thanks for the update.  Maybe lets not worry about SED driver immediatly. 

    What about in the "Threat protection" policy if you disable:

    "Enable Threat Case creation"?

    After doing so in Central, on the client: "snapshot_upload_uri" under:
    "HKEY_LOCAL_MACHINE\SOFTWARE\Sophos\EndpointDefense\PolicyConfiguration"
    ...will go from having a URL to being an empty string on the client once disabled.

    This is something else that SSPService is involved with.

    Also, any errors of interest in here:
    "C:\ProgramData\Sophos\Endpoint Defense\Logs\sdr.log"

    Regards,
    Jak

  • SED driver has some unfreed allocations. This seems generally stable however,


    SDR log has one per minute of the following:

    SDR Proc Error Failure encoding all processes! Func: 2 Type: 3 BufLeft: 93772
  • Do you see the problem if you disable "Enable Threat Case creation"?

    Also, if you "restart" the computer, how quickly does the problem occur?  Does it take minutes or hours?

    Does it happen at a certain time(s) following the startup and is that the same time(s)?  if it starts occurring at a certain time each day, what happens on the machine at this time which could be the trigger?

    I suppose the question is, can you predict when it will occur?

    Regards,

    Jak


  • Just to keep everyone in the loop,


    I done a process dump (on request of sophos) - its 23gb in size (ouch) - however, interestingly: I noticed my machine starting to get slow, so i opened task manager and notice that the SSPService was taking about 2-3GB of ram - not a deal breaker, but it thought, its the start of it, i will take a process dump now!


    When process dump gathered everything it echoed "Writing 23gb to file..." then RAM consumption from SSPService shot up to 99% - hung my pc and it eventually blue screened (it did however manage to write the dump to file) - so Sophos will have something to use to check whats going on!

  • > Do you see the problem if you disable "Enable Threat Case creation"?

    Have only just disabled this so ... dunno.  Will let you know.

    >Also, if you "restart" the computer, how quickly does the problem occur?  Does it take minutes or hours?

    Well it generally takes hours for the problem to reach the point where a machine actually crashes.

    But that's not to say it doesn't *start* happening soon after boot, it's not easy to tell increasing memory use due to increasing system activity from increasing memory use due to a leak.

    (For users experiencing the problem crashes per user per day range from 0.5 to 2)

    > Does it happen at a certain time(s) following the startup and is that the same time(s)?

    No.

    > if it starts occurring at a certain time each day, what happens on the machine at this time which could be the trigger?

    > I suppose the question is, can you predict when it will occur?

    No.

    I promise that if I do find out I will not hold this information back.


  • Thank you for your response. To get better data on when it might start, I would suggest:

    1. Restart the computer.

    2. Once logged in, start an admin prompt and run the command:

    typeperf "\Process(SSPService)\Handle Count" "\Process(SSPService)\Pool Nonpaged Bytes" "\Process(SSPService)\Pool Paged Bytes" "\Process(SSPService)\Private Bytes" "\Process(SSPService)\Working Set" "\Process(SSPService)\Working Set - Private" -O %temp%\sspservice.csv -si 30

    Note: It's all one line. 

    This will sample some of the Windows performance counters for the SSPService every 30 seconds and record the data in %temp%\sspservice.csv.

    If you leave it running until the issue starts and then leave it as long as possible when the issue is occuring it will tell us:
    1. When it started relevant to startup.

    2. The rate of the memory usage over time.

    Maybe you can attach the file here when complete?  Ideally repeating the test twice following the restart to see if:

    1. It does start at a certian time.
    2. It starts at a certain amount of time following startup.

    I suspect it's pretty flat, some event takes place and then it goes up.

    Many thanks again,
    Jak

  • Okay, why not.

    FWIW I've already uploaded extensive perfmon logs of the SSPService process to my support case.

    Over a 23 hour period from ~ 11:20 to ~10:20 on an affected machine with user session logged on throughout but inactive and locked between ~17:30 and ~09:20:

    Handle count varied between 106k and 152k with an average of 131k with the highest points being shortly after user unlock.

    Pool non-paged bytes varied between 5.4m and 15.3m with a steady climb seen after ~ 7 hours and which continued through user unlock with no change in the rate of increase.

    Pool paged bytes varied between 61m and 93m with several rapid increases including one at user unlock.

    Private bytes and Working set showed a general gentle upward trend with a slightly greater rate of increase following user unlock.

    Working set - private showed a general upward trend with a sharp increase after ~7.5 hours followed by a greater rate of increase than the previous trend and a spike (rapid increase followed by rapid decrease to a point on the previous, steeper trend line) around user unlock.

    I won't attach the huge file but here's a screenshot interesting counters include Working Set - Private highlighted in bold black, Pool Paged Bytes in red, I/O Other in cyan: