This discussion has been locked.
You can no longer post new replies to this discussion. If you have a question you can start a new discussion

XG Firewall marking Endpoint to "at risk" - Endpoint reporting Heartbeat Status 3

Why is this endpoint reporting Heartbeat Status Red to our XG Firewall this morning? Status "At Risk"!

As result the user cannot access most applications.
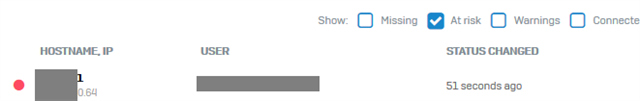
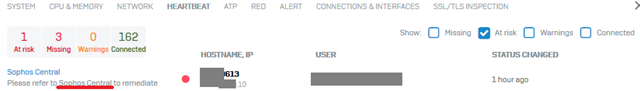
XG Showing this:

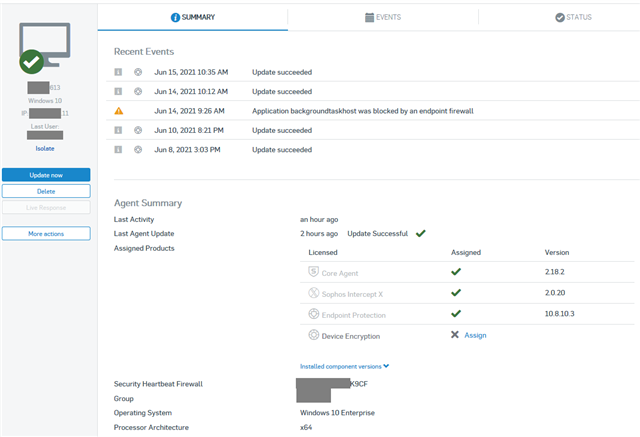
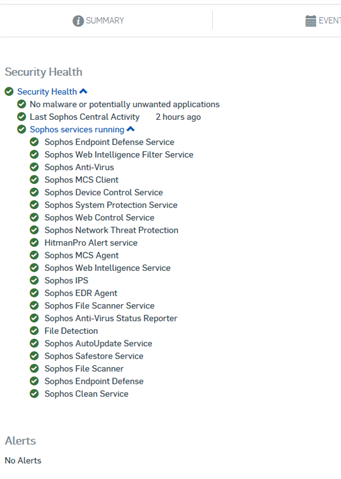
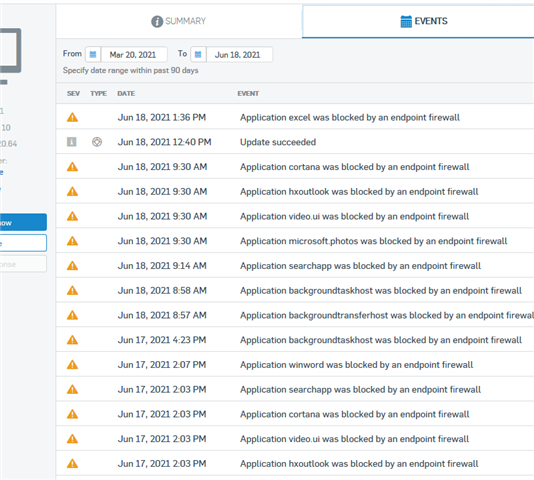
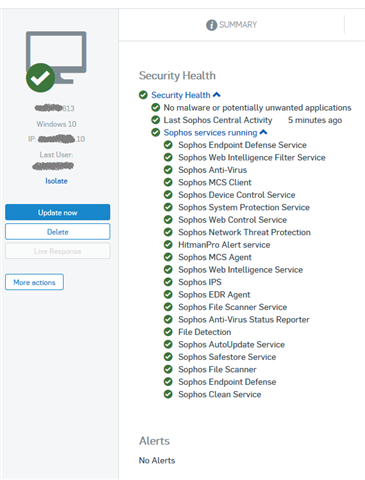
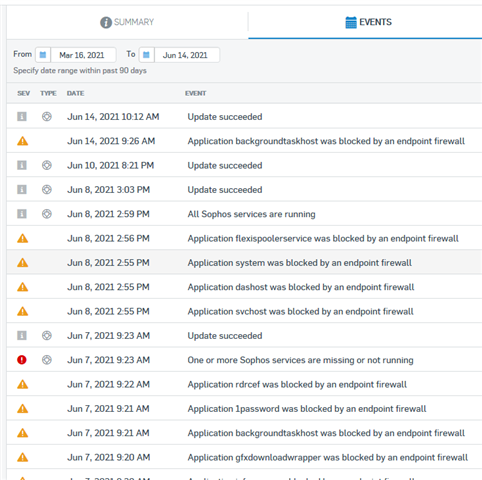
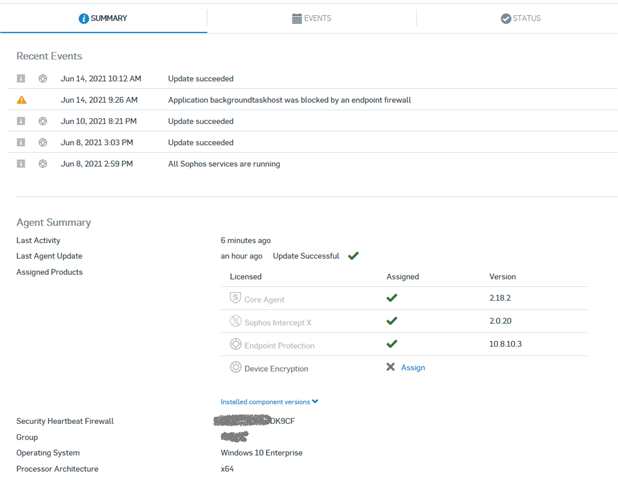
Central is showing this:
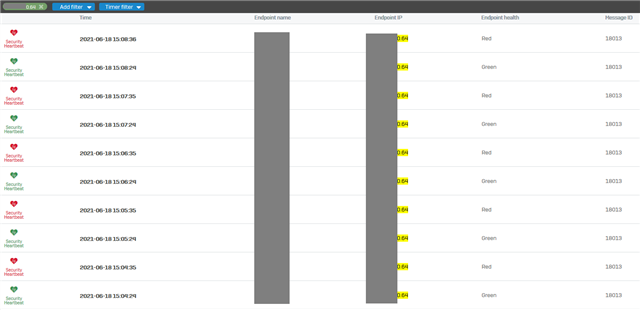
XG Log:

XG430_WP02_SFOS 18.0.5 MR-5-Build586# grep "xxxxxxx-4c58-4236-9dbc-xxxxxxxxxxx" /log/heartbeatd.log
2021-06-14 09:28:19 INFO EndpointStorage.cpp[17627]:114 endpoint_connectivity_cb - Connectivity changed for <xxxxxxx-4c58-4236-9dbc-xxxxxxxxxxx>: <3> -> <1>
2021-06-14 09:28:19 INFO EpStateListBroker.cpp[17627]:56 markEndpointForUpdates - Endpoint marked for receiving Stonewall updates: xxxxxxx-4c58-4236-9dbc-xxxxxxxxxxx(SSL-VPN-IP.40)
2021-06-14 09:28:25 INFO ModuleStatus.cpp[17627]:138 processMessageStatus - Status request received from endpoint: xxxxxxx-4c58-4236-9dbc-xxxxxxxxxxx (SSL-VPN-IP.40) health: 3
2021-06-14 09:32:00 INFO SacProcessor.cpp[17627]:64 discardApp - Sent switchOffConnectionInfo request to endpoint: <xxxxxxx-4c58-4236-9dbc-xxxxxxxxxxx>, Application path :C:\134program files (x86)\134mozilla firefox\134firefox.exe
2021-06-14 09:32:50 INFO EndpointStorage.cpp[17627]:114 endpoint_connectivity_cb - Connectivity changed for <xxxxxxx-4c58-4236-9dbc-xxxxxxxxxxx>: <1> -> <5>
2021-06-14 09:32:53 INFO EndpointStorage.cpp[17627]:114 endpoint_connectivity_cb - Connectivity changed for <xxxxxxx-4c58-4236-9dbc-xxxxxxxxxxx>: <5> -> <1>
2021-06-14 09:32:53 INFO EpStateListBroker.cpp[17627]:56 markEndpointForUpdates - Endpoint marked for receiving Stonewall updates: xxxxxxx-4c58-4236-9dbc-xxxxxxxxxxx(SSL-VPN-IP.40)
2021-06-14 09:32:55 INFO ModuleStatus.cpp[17627]:138 processMessageStatus - Status request received from endpoint: xxxxxxx-4c58-4236-9dbc-xxxxxxxxxxx (SSL-VPN-IP.40) health: 3
2021-06-14 09:37:01 INFO SacProcessor.cpp[17627]:64 discardApp - Sent switchOffConnectionInfo request to endpoint: <xxxxxxx-4c58-4236-9dbc-xxxxxxxxxxx>, Application path :C:\134program files (x86)\134mozilla firefox\134firefox.exe
2021-06-14 10:02:23 INFO EndpointStorage.cpp[17627]:114 endpoint_connectivity_cb - Connectivity changed for <xxxxxxx-4c58-4236-9dbc-xxxxxxxxxxx>: <1> -> <3>
2021-06-14 10:02:31 INFO EndpointStorage.cpp[17627]:114 endpoint_connectivity_cb - Connectivity changed for <xxxxxxx-4c58-4236-9dbc-xxxxxxxxxxx>: <3> -> <1>
2021-06-14 10:02:31 INFO EpStateListBroker.cpp[17627]:56 markEndpointForUpdates - Endpoint marked for receiving Stonewall updates: xxxxxxx-4c58-4236-9dbc-xxxxxxxxxxx(SSL-VPN-IP.15)
2021-06-14 10:02:34 INFO ModuleStatus.cpp[17627]:138 processMessageStatus - Status request received from endpoint: xxxxxxx-4c58-4236-9dbc-xxxxxxxxxxx (SSL-VPN-IP.15) health: 3
2021-06-14 10:13:31 INFO EndpointStorage.cpp[17627]:114 endpoint_connectivity_cb - Connectivity changed for <xxxxxxx-4c58-4236-9dbc-xxxxxxxxxxx>: <1> -> <3>
2021-06-14 10:13:34 INFO EndpointStorage.cpp[17627]:114 endpoint_connectivity_cb - Connectivity changed for <xxxxxxx-4c58-4236-9dbc-xxxxxxxxxxx>: <3> -> <1>
2021-06-14 10:13:35 INFO EpStateListBroker.cpp[17627]:56 markEndpointForUpdates - Endpoint marked for receiving Stonewall updates: xxxxxxx-4c58-4236-9dbc-xxxxxxxxxxx(SSL-VPN-IP.10)
2021-06-14 10:13:44 INFO ModuleStatus.cpp[17627]:138 processMessageStatus - Status request received from endpoint: xxxxxxx-4c58-4236-9dbc-xxxxxxxxxxx (SSL-VPN-IP.10) health: 3


This thread was automatically locked due to age.
  • The only thing that stands out is the services missing or stopped - do you have access to the machine? If yes, open the Endpoint Self-Help tool and see if it reports the same. If it does - then see which service is at fault and correct it. If it doesn't, take a look at the registry and see if the key HKEY_LOCAL_MACHINE\SOFTWARE\WOW6432Node\Sophos\Health\Status has anything other than 1 for admin, health, service, or threat.

    RichardP

    Program Manager, Support Readiness | CISSP | Sophos Technical Support
    Support Videos | Product Documentation | @SophosSupport | Sign up for SMS Alerts
    If a post solves your question use the 'Verify Answer' link.

  • Does it help to:
    1. Disable Tamper on the client from Central

    2. Stop the Sophos Health service

    3. Rename C:\ProgramData\Sophos\Health\Event Store\Database\events.db to old.db for example.

    4. Start the Sophos Health service

    5. Re-enable Tamper.

    Just curious.
    Thanks.

  • Don't do this until you look at the actual state of the machine. This will delete the current statue which isn't good if the issue is persistent. Instead, check first and if everything is reporting fine - then you can try renaming the DB.

    RichardP

    Program Manager, Support Readiness | CISSP | Sophos Technical Support
    Support Videos | Product Documentation | @SophosSupport | Sign up for SMS Alerts
    If a post solves your question use the 'Verify Answer' link.

  • The only thought was, if it helps then you could switch the file back. At least the state is captured in the database file.

  • Thanks for your replies!

    Yes, I saw the event not all services running but this was days ago and the current status was: all up and running.

    As this was the machine of a CO, I did'nt want to bother him with technical stuff. Currently the machine is offline, will see what happens today. Yesterday the machine stayed at status red.

  • Machine is green today after a cold boot.

    Strange issue though. Would really expect to see at least something in Sophos Central when Central reports status red/risk to the firewall.

    No new helpful Events added to central. Just one update event. I don't like blackboxes.

  • just an other one today, flipping between red and green all the time. XG reports this client as "red, "at risk". Why?

    What's the use of Central events, if you see NOTHING useful there (btw. not even the heartbeat ID).

    XG part:

    2021-06-18 10:01:40 INFO EndpointStorage.cpp[17627]:114 endpoint_connectivity_cb - Connectivity changed for <xxxxxxxx-ed46-48ce-896d-xxxxxxxxxxx>: <1> -> <3>
    2021-06-18 11:55:37 INFO EndpointStorage.cpp[17627]:114 endpoint_connectivity_cb - Connectivity changed for <xxxxxxxx-ed46-48ce-896d-xxxxxxxxxxx>: <3> -> <1>
    2021-06-18 11:55:37 INFO EpStateListBroker.cpp[17627]:56 markEndpointForUpdates - Endpoint marked for receiving Stonewall updates: xxxxxxxx-ed46-48ce-896d-xxxxxxxxxxx(xx.xx.x0.64)
    2021-06-18 11:55:41 INFO ModuleStatus.cpp[17627]:138 processMessageStatus - Status request received from endpoint: xxxxxxxx-ed46-48ce-896d-xxxxxxxxxxx (xx.xx.x0.64) health: 3
    2021-06-18 11:56:24 INFO ModuleStatus.cpp[17627]:138 processMessageStatus - Status request received from endpoint: xxxxxxxx-ed46-48ce-896d-xxxxxxxxxxx (xx.xx.x0.64) health: 1
    2021-06-18 11:56:26 INFO ModuleStatus.cpp[17627]:138 processMessageStatus - Status request received from endpoint: xxxxxxxx-ed46-48ce-896d-xxxxxxxxxxx (xx.xx.x0.64) health: 3
    2021-06-18 11:57:25 INFO ModuleStatus.cpp[17627]:138 processMessageStatus - Status request received from endpoint: xxxxxxxx-ed46-48ce-896d-xxxxxxxxxxx (xx.xx.x0.64) health: 1
    2021-06-18 11:57:26 INFO ModuleStatus.cpp[17627]:138 processMessageStatus - Status request received from endpoint: xxxxxxxx-ed46-48ce-896d-xxxxxxxxxxx (xx.xx.x0.64) health: 3
    ...
    2021-06-18 15:05:35 INFO ModuleStatus.cpp[17627]:138 processMessageStatus - Status request received from endpoint: xxxxxxxx-ed46-48ce-896d-xxxxxxxxxxx (xx.xx.x0.64) health: 3
    2021-06-18 15:06:24 INFO ModuleStatus.cpp[17627]:138 processMessageStatus - Status request received from endpoint: xxxxxxxx-ed46-48ce-896d-xxxxxxxxxxx (xx.xx.x0.64) health: 1
    2021-06-18 15:06:35 INFO ModuleStatus.cpp[17627]:138 processMessageStatus - Status request received from endpoint: xxxxxxxx-ed46-48ce-896d-xxxxxxxxxxx (xx.xx.x0.64) health: 3
    2021-06-18 15:07:24 INFO ModuleStatus.cpp[17627]:138 processMessageStatus - Status request received from endpoint: xxxxxxxx-ed46-48ce-896d-xxxxxxxxxxx (xx.xx.x0.64) health: 1
    2021-06-18 15:07:35 INFO ModuleStatus.cpp[17627]:138 processMessageStatus - Status request received from endpoint: xxxxxxxx-ed46-48ce-896d-xxxxxxxxxxx (xx.xx.x0.64) health: 3


    screenshot added
    [bearbeitet von: LHerzog um 1:19 PM (GMT -7) am 18 Jun 2021]
  • we have again one machine that is at risk on XG with green state in Central. Now have a support case open for this issues. The way the support case began, I expect a long ping pong without solution in the far end.

    this is, what the client heartbeat.log shows. Looks quite similar to what XG reports.

    a 2021-06-24T10:08:10.180Z [5400:6844] - Received notification of endpoint state changes, size: 1
    a 2021-06-24T10:08:46.691Z [5400:6844] - Sending health status: {"admin":1, "health":1, "service":1, "threat":1}
    a 2021-06-24T10:08:46.693Z [5400:6844] - Received notification of endpoint state changes, size: 1
    a 2021-06-24T10:09:01.717Z [5400:6844] - Sending health status: {"health":3}
    a 2021-06-24T10:09:01.835Z [5400:6844] - Received notification of endpoint state changes, size: 1
    a 2021-06-24T10:09:55.193Z [5400:6844] - Sending health status: {"admin":1, "health":1, "service":1, "threat":1}
    a 2021-06-24T10:09:55.201Z [5400:6844] - Received notification of endpoint state changes, size: 1
    a 2021-06-24T10:10:16.839Z [5400:6844] - Sending health status: {"health":3}
    a 2021-06-24T10:10:16.841Z [5400:6844] - Received notification of endpoint state changes, size: 1
    a 2021-06-24T10:10:55.197Z [5400:6844] - Sending health status: {"admin":1, "health":1, "service":1, "threat":1}
    a 2021-06-24T10:10:55.200Z [5400:6844] - Received notification of endpoint state changes, size: 1
    a 2021-06-24T10:11:01.903Z [5400:6844] - Sending health status: {"health":3}
    a 2021-06-24T10:11:10.202Z [5400:6844] - Received notification of endpoint state changes, size: 1
    a 2021-06-24T10:11:15.389Z [5400:6844] - Connection closed (network error).
    a 2021-06-24T10:11:16.402Z [5400:6844] - Connection failed.
    a 2021-06-24T10:42:07.117Z [5400:6844] - The connection configuration has changed. Reloading settings.
    a 2021-06-24T10:55:49.858Z [5400:6160] - ----------------------------------------------------------------------------------------------------
    a 2021-06-24T10:55:49.858Z [5400:6160] - Stopped Heartbeat
    a 2021-06-24T10:55:49.859Z [5400:6160] - ----------------------------------------------------------------------------------------------------
    a 2021-06-24T10:56:35.734Z [5368:6744] - ----------------------------------------------------------------------------------------------------
    a 2021-06-24T10:56:35.734Z [5368:6744] - Starting Heartbeat version 1.11.194.0
    a 2021-06-24T10:56:35.734Z [5368:6744] - ----------------------------------------------------------------------------------------------------
    a 2021-06-24T10:56:35.779Z [5368:7784] - Connection failed.
    a 2021-06-24T12:07:41.471Z [5368:7784] - Connection succeeded.
    a 2021-06-24T12:07:41.485Z [5368:7784] - Connected to 'xxxxxxxx-ede8-4fbd-99b1-xxxxxxxxxxxx' at IP address 52.5.76.173 on port 8347
    a 2021-06-24T12:11:29.084Z [5368:7784] - Sending network status. Active Interfaces:
    MAC: 00:15:5D:31:XX:XX - INET: 172.xxxxx - INET6: fe80::d490:xxxxxxxxxxx
    MAC: 00:15:5D:47:XX:XX - INET: 172.xxxxx - INET6: fe80::bdf1:xxxxxxxxxxx
    MAC: 00:15:5D:E1:XX:XX - INET: 172.xxxxx - INET6: fe80::b44b:xxxxxxxxxxx
    MAC: 00:15:5D:EC:XX:XX - INET: 172.xxxxx - INET6: fe80::4dd2:xxxxxxxxxxx
    MAC: 0A:00:27:00:XX:XX - INET: 192.xxxxx - INET6: fe80::3ce6:xxxxxxxxxxx
    MAC: 58:82:A8:8F:XX:XX - INET: 172.xxxxx - INET6: fe80::adb0:xxxxxxxxxxx
    a 2021-06-24T12:11:29.086Z [5368:7784] - Received request to enable enhanced application control
    a 2021-06-24T12:11:29.087Z [5368:7784] - Sending endpoint state list request
    a 2021-06-24T12:11:29.088Z [5368:7784] - Received response to endpoint state list request, size: 1
    a 2021-06-24T12:11:29.097Z [5368:7784] - Sending login status.
    a 2021-06-24T12:11:32.188Z [5368:7784] - Sending health status: {"health":3}
    a 2021-06-24T12:11:32.190Z [5368:7784] - Received notification of endpoint state changes, size: 1
    a 2021-06-24T12:11:47.216Z [5368:7784] - Sending health status: {"admin":1, "health":1, "service":1, "threat":1}
    a 2021-06-24T12:11:47.219Z [5368:7784] - Received notification of endpoint state changes, size: 1
    a 2021-06-24T12:12:47.343Z [5368:7784] - Sending health status: {"health":3}
    a 2021-06-24T12:12:47.438Z [5368:7784] - Received notification of endpoint state changes, size: 1
    a 2021-06-24T12:12:58.600Z [5368:7784] - Sending health status: {"admin":1, "health":1, "service":1, "threat":1}
    a 2021-06-24T12:13:02.363Z [5368:7784] - Sending health status: {"health":3}
    a 2021-06-24T12:13:32.409Z [5368:7784] - Sending health status: {"admin":1, "health":1, "service":1, "threat":1}
    a 2021-06-24T12:13:32.411Z [5368:7784] - Received notification of endpoint state changes, size: 1
    a 2021-06-24T12:14:02.464Z [5368:7784] - Sending health status: {"health":3}
    a 2021-06-24T12:14:02.466Z [5368:7784] - Received notification of endpoint state changes, size: 1
    a 2021-06-24T12:14:17.507Z [5368:7784] - Sending health status: {"admin":1, "health":1, "service":1, "threat":1}
    a 2021-06-24T12:14:17.510Z [5368:7784] - Received notification of endpoint state changes, size: 1
    a 2021-06-24T12:14:32.547Z [5368:7784] - Sending health status: {"health":3}
    a 2021-06-24T12:14:32.549Z [5368:7784] - Received notification of endpoint state changes, size: 1
    a 2021-06-24T12:14:58.585Z [5368:7784] - Sending health status: {"admin":1, "health":1, "service":1, "threat":1}
    a 2021-06-24T12:14:58.588Z [5368:7784] - Received notification of endpoint state changes, size: 1
    a 2021-06-24T12:15:17.632Z [5368:7784] - Sending health status: {"health":3}
    a 2021-06-24T12:15:17.635Z [5368:7784] - Received notification of endpoint state changes, size: 1
    a 2021-06-24T12:15:58.585Z [5368:7784] - Sending health status: {"admin":1, "health":1, "service":1, "threat":1}
    a 2021-06-24T12:15:58.919Z [5368:7784] - Received notification of endpoint state changes, size: 1
    a 2021-06-24T12:16:02.718Z [5368:7784] - Sending health status: {"health":3}
    a 2021-06-24T12:16:13.917Z [5368:7784] - Received notification of endpoint state changes, size: 1
    a 2021-06-24T12:16:58.579Z [5368:7784] - Sending health status: {"admin":1, "health":1, "service":1, "threat":1}
    a 2021-06-24T12:16:58.581Z [5368:7784] - Received notification of endpoint state changes, size: 1
    a 2021-06-24T12:17:02.771Z [5368:7784] - Sending health status: {"health":3}
    a 2021-06-24T12:17:13.578Z [5368:7784] - Received notification of endpoint state changes, size: 1
    a 2021-06-24T12:17:17.787Z [5368:7784] - Sending health status: {"admin":1, "health":1, "service":1, "threat":1}
    a 2021-06-24T12:17:28.579Z [5368:7784] - Received notification of endpoint state changes, size: 1
    a 2021-06-24T12:17:47.852Z [5368:7784] - Sending health status: {"health":3}

  • Hi LHerzog,

    I have the same behaviour on some Lenovo notebooks. Do you have a solution yet?
    I just had a 90 minute support session with Sophos support. Result: Client/Firewall/Central communication OK. I was advised to reinstall Central on the client and then report back to support.

    Best

    M

  • Hello,  no solution found so far.

    I opened the case with XG team, now they moved it over to the Intercept X Team, because they believe the change is from the Endpoint. This is what I think too.

    They requested the following:

    1. Can you tell me exactly how the machine is connected to the network, including topology (important)
    2. Is this a laptop/desktop,
    3. If this is a laptop is there a dock in use,
    4. How long has this been going on for,
    5. Has there been any changes to the network such as a replacement modem/cables/changes in network topology etc.

    Could you please send a fresh SDU logs from the Endpoint/Server and please enable remote assistance to Sophos Central.

    I'm currently collecting this information.

    We noticed it on Dell Notebooks and a MS Surface. All with some native or USB-C Docks. Partially connected to LAN and WiFi at the same time (may be some issue).

    we were discussing a similar issue here as well: community.sophos.com/.../sophos-heartbeat---red-in-xg-but-green-in-central